This page covers on how to manage and use dataapps.
DataApps
DataApps are interactive visualizations built using React, designed to address four main problem types within Rapid Model Recipes: Binary Classification, Regression, Multi-Class Classification, and Binary Experimental.
There are two primary types of DataApps that can be created: Custom DataApps and Import DataApps
Custom DataApps
Custom DataApps come in two variations: Model Independent and Model Dependent (Model DataApp). These DataApps are flexible and can support a variety of data sources, making them versatile for different use cases.
Types of Custom DataApps:
Project Canvas Datasets: Use datasets available on the project canvas, including user-uploaded datasets. This option also supports interactive data exploration using AskAI.
Uploaded Datasets: Upload your own datasets and apply AskAI to analyze them, providing an easy way to explore your data without needing a model.
SQL Sources: Connect to MySQL databases via pre-configured connectors to fetch and analyze data directly from these sources using AskAI.
Documents and PDFs: Upload documents in formats like PDF, DOC, and DOCX, and use AskAI to query the document contents. This enables quick extraction of insights and analysis of text-based information.
Prediction Services: Select a pre-configured prediction service linked to your project to query AI models directly via the AskAI interface.
Job: Choose input datasets, define output datasets, and access reports generated after running jobs. This allows you to run queries on the selected files through AskAI.
Model: Model DataApps are dependent on a trained model and can only be created if a project includes one. These DataApps focus on visualizing the performance and predictions of the specific model within your project.
Import DataApps
The platform allows you to upload custom DataApps developed with popular frameworks such as ReactJS and Streamlit.After successfully uploading your DataApp, the platform will automatically generate relevant graphs and visualizations based on the integrated data. Import DataApp. To import a DataApp to the platform, see Importing DataApps developed through ReactJS or Streamlit.
Building and Consuming DataApps with Jupyter Notebooks
DataApps can also be built by writing Python code in Jupyter Notebooks, allowing data scientists to create app templates that business users can consume once deployed. Here’s how the process works:
Data Scientist’s Role: Data scientists first create an app template in Jupyter Notebook. They then deploy the DataApp by passing a project ID, scenario, artifact, or model.
Business User’s Role: Business users can only view and delete DataApps published to the UI from the Notebook. They cannot create or modify app templates. All app templates created within a tenant are stored in the DataApp module.
Generating Charts:
Users can generate charts by creating custom templates in the Notebook or using existing system templates. Some examples of system templates include:
Correlation Matrix
EDA Data Drift
Pivot Table Viewer
Visual Analytics
Pandas Profiler, etc.
Charts can be generated using either a custom or system template, but only the default Streamlit version is supported. In contrast, DataApps support all Streamlit versions.
App Templates: App templates are similar to system templates but are specifically used to generate DataApps (charts).
Accessing and Creating a Model DataApp at a project level
Use this procedure to create a model DataApp in a project. After you run the data pipeline for any of these four problem types such as binary classification, regression, multi-class classification, or binary experimental problems, the DataApp button gets enabled.
Hover over the menu icon and select Projects
Select the project for which you want to create DataApps and click the DataApps icon from the project level navigation.
If no DataApps are available, you will see a screen with options - Custom DataApps or Import DataApps.
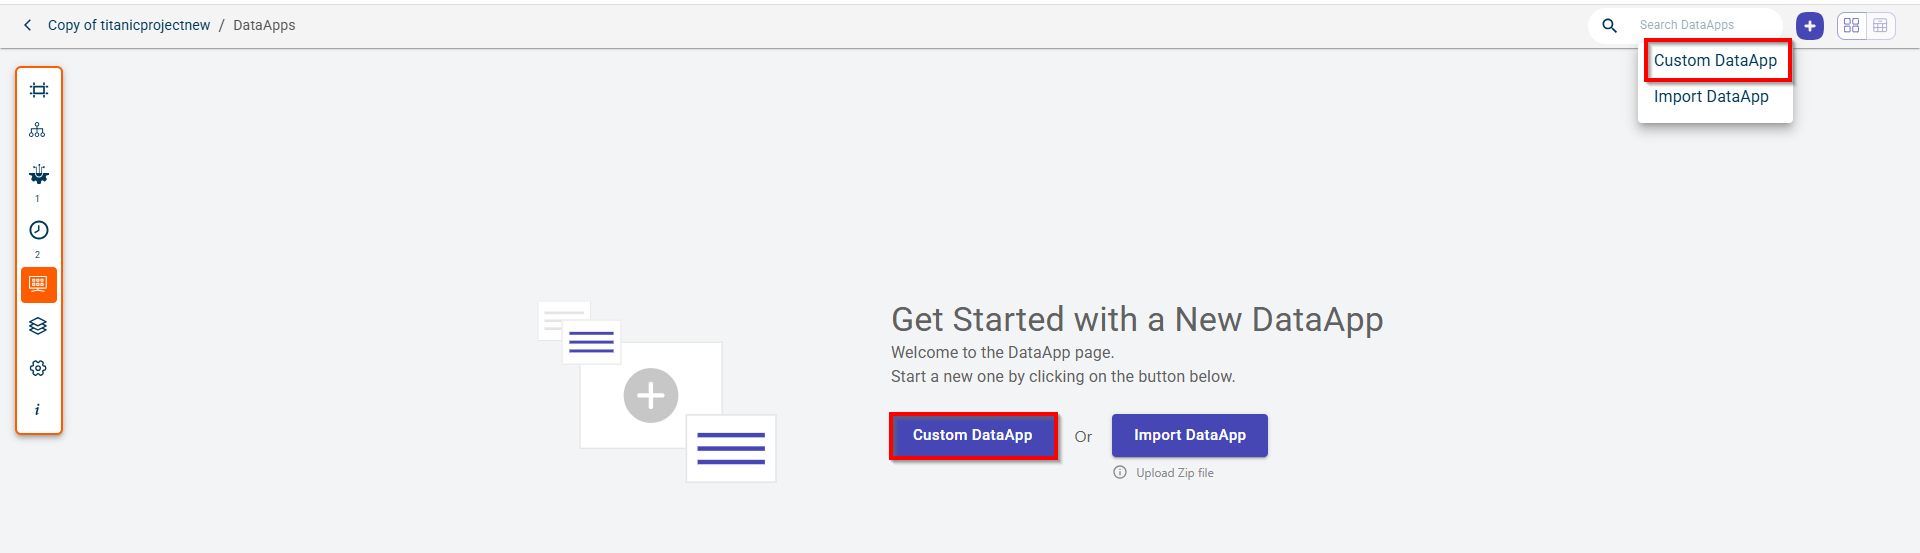
Click the plus icon and select Custom DataApp. Alternatively, click Custom DataApp in the DataApp workspace.
Select Model DataApp from the inputs.
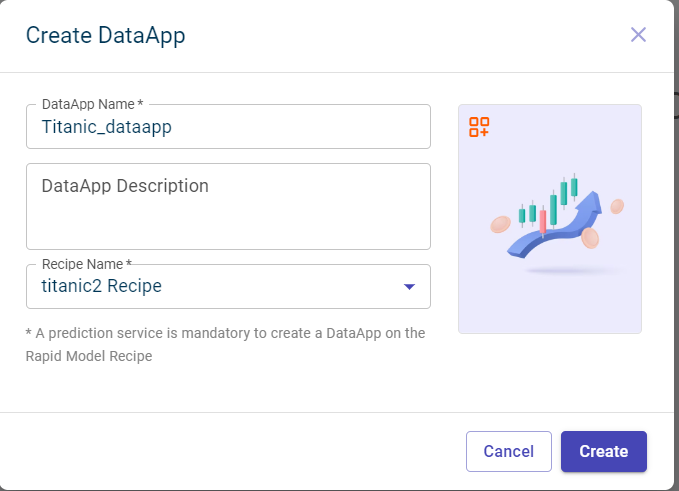
Specify this information:
- DataApp Name:
The name of the DataApp.
- DataApp Description:
The description of the DataApp.
- Recipe Name:
The recipe for which you want to create a DataApp.
- Environment:
By default, the environment selected during project creation is applied. However, you have the flexibility to choose a different environment for running your DataApps.
- Choose Image:
Click to upload an image to display on the DataApp card that you see on the DataApps page.
Enter Model controls in the text box to provide specific context to the AI guide. This helps in aligning the AI-generated responses more closely with the user’s particular use case.
Toggle ON the Show Model Response Code option to view the code generated by the model in response to the queries.
Enable Allow Column Hyperlinks to create hyperlinks between columns in related tables.
Click Create.
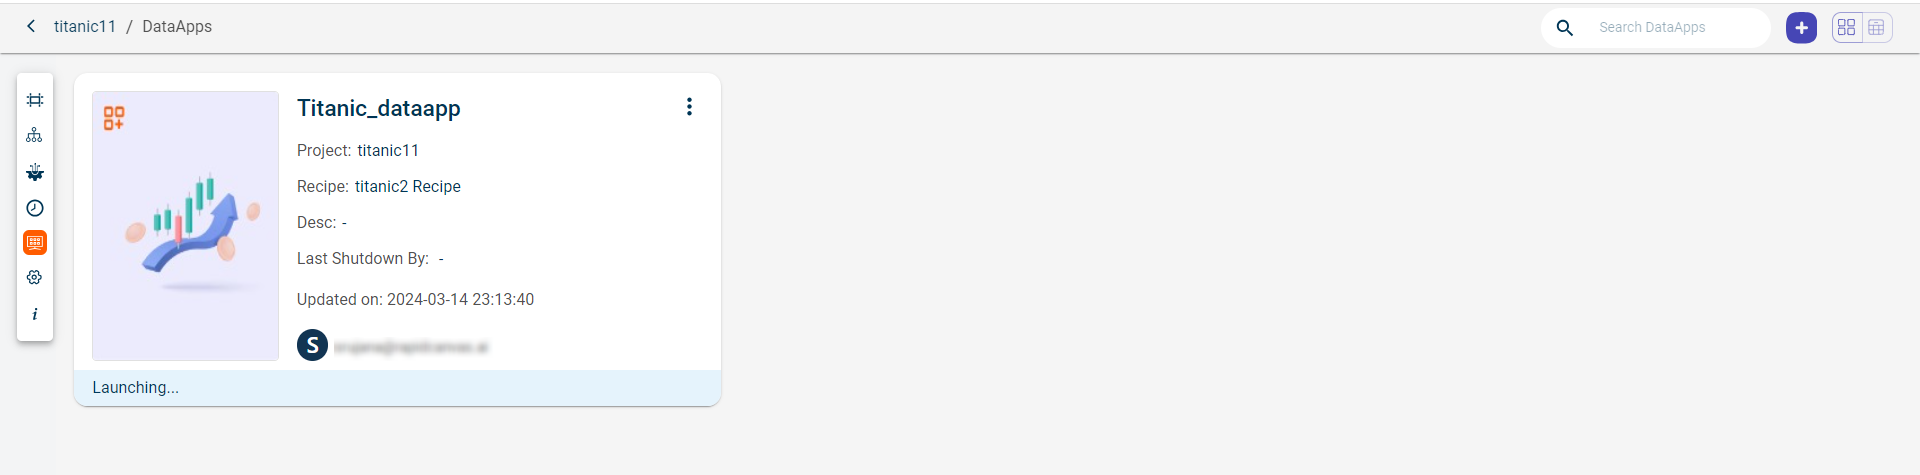
You can see the DataApp card created in this project.
Viewing dataapps in a tenant
Use this procedure to view the dataapps created on the UI or published by Notebook users from Notebook.
Hover over the menu icon and select DataApps. This displays the dataapps dashboard where you can see all the DataApps for different projects in this tenant.
Note
The DataApps will become inactive after a certain period set by the admin. If you want to use DataApps, you must relaunch.
Click Relaunch on the DataApp card that you want to launch again.
Click on the Dataapp. The screen displays the following tabs:
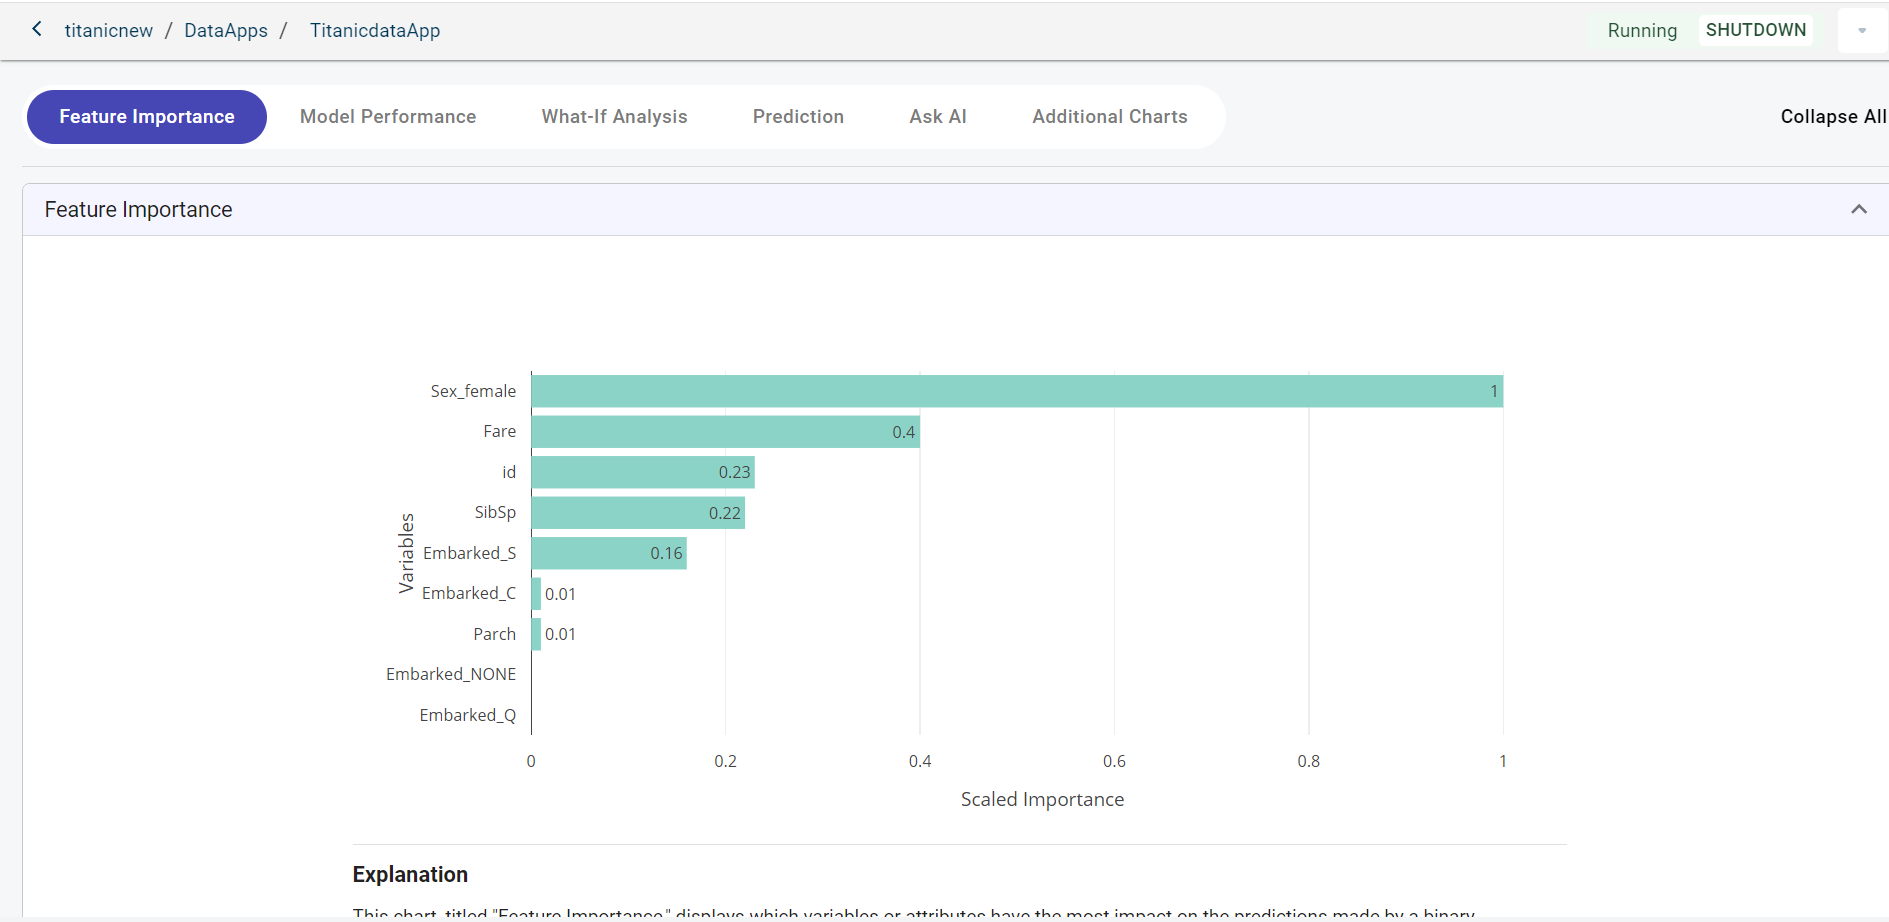
Feature importance - Assigning scores to input features based on how helpful they are in predicting a target variable. These scores are ranked to help users understand which features have a significant impact on model prediction.
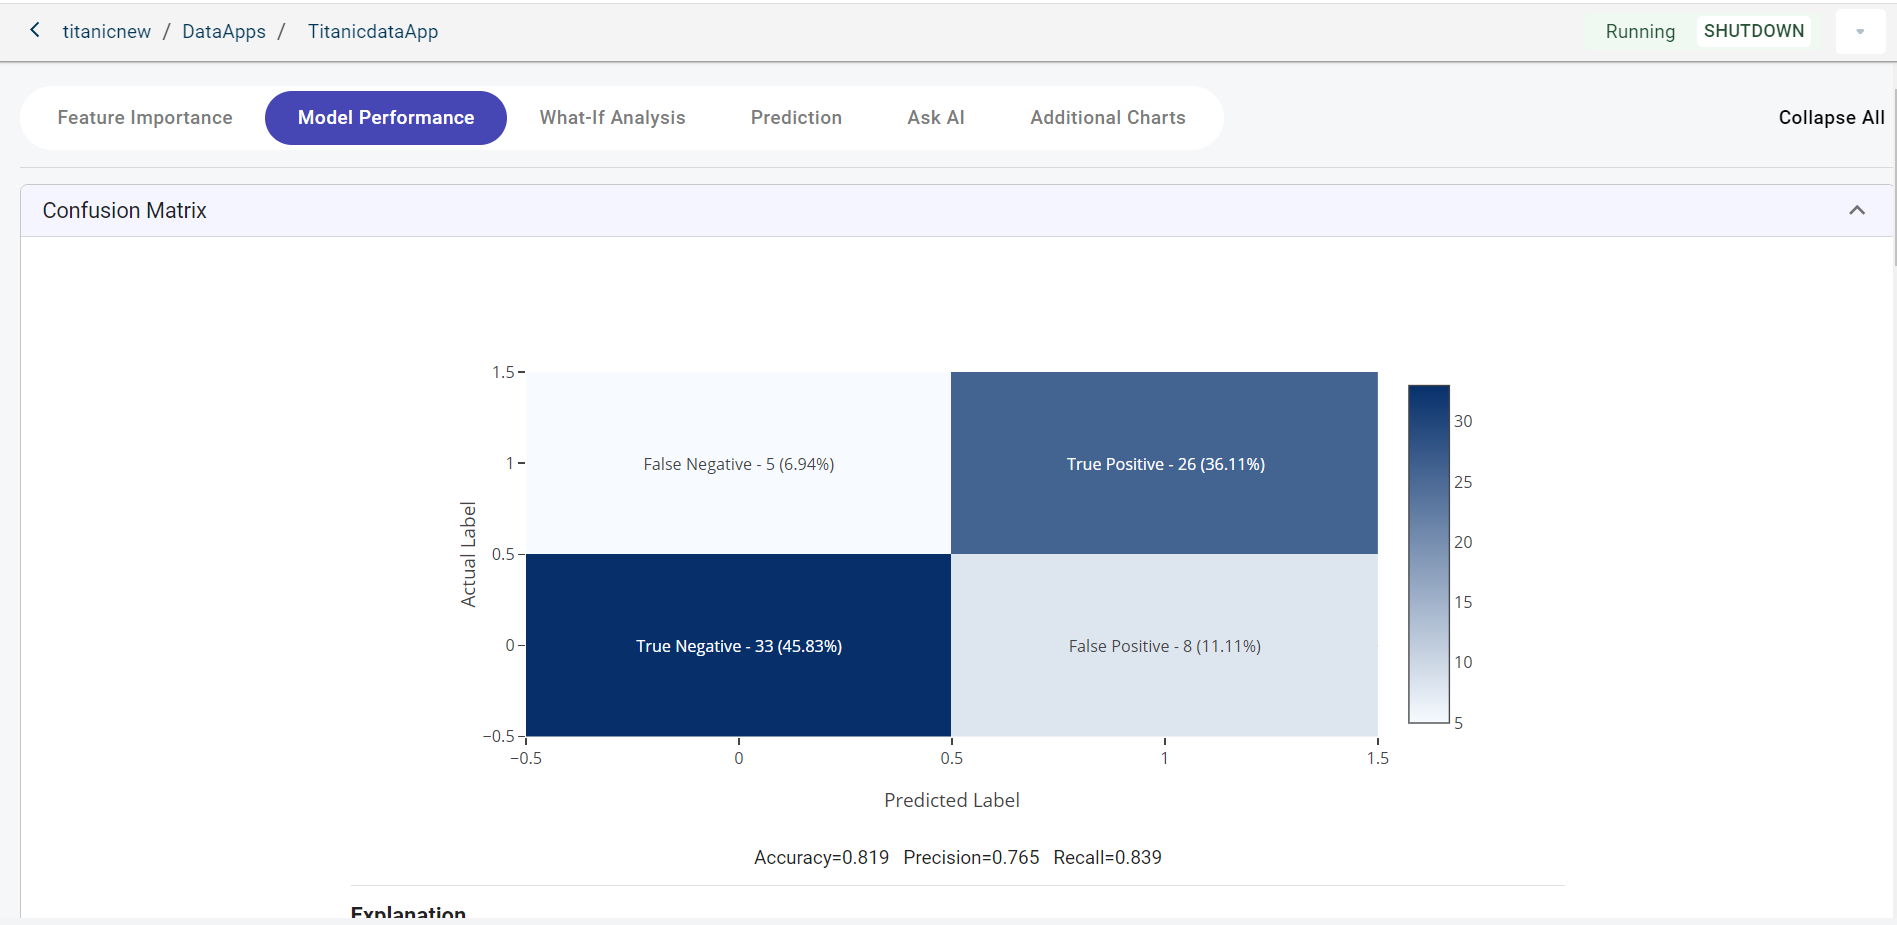
Model performance - This evaluates the performance of the model.
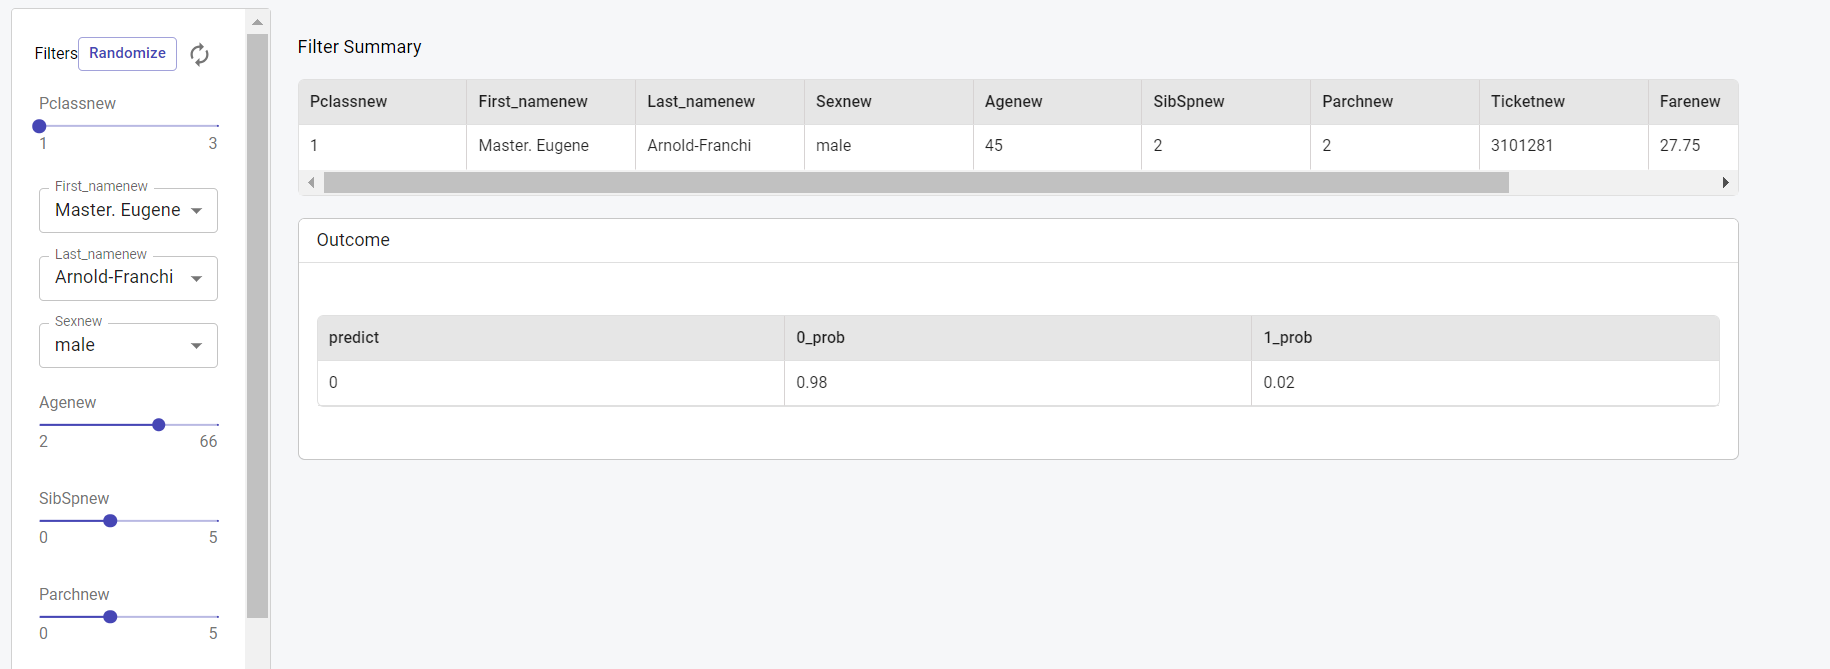
What-If analysis - Help data scientists to get insights into what a model predicts for given input values. This allows them to experiment with various combinations of values for key features and observe the resulting predictions.
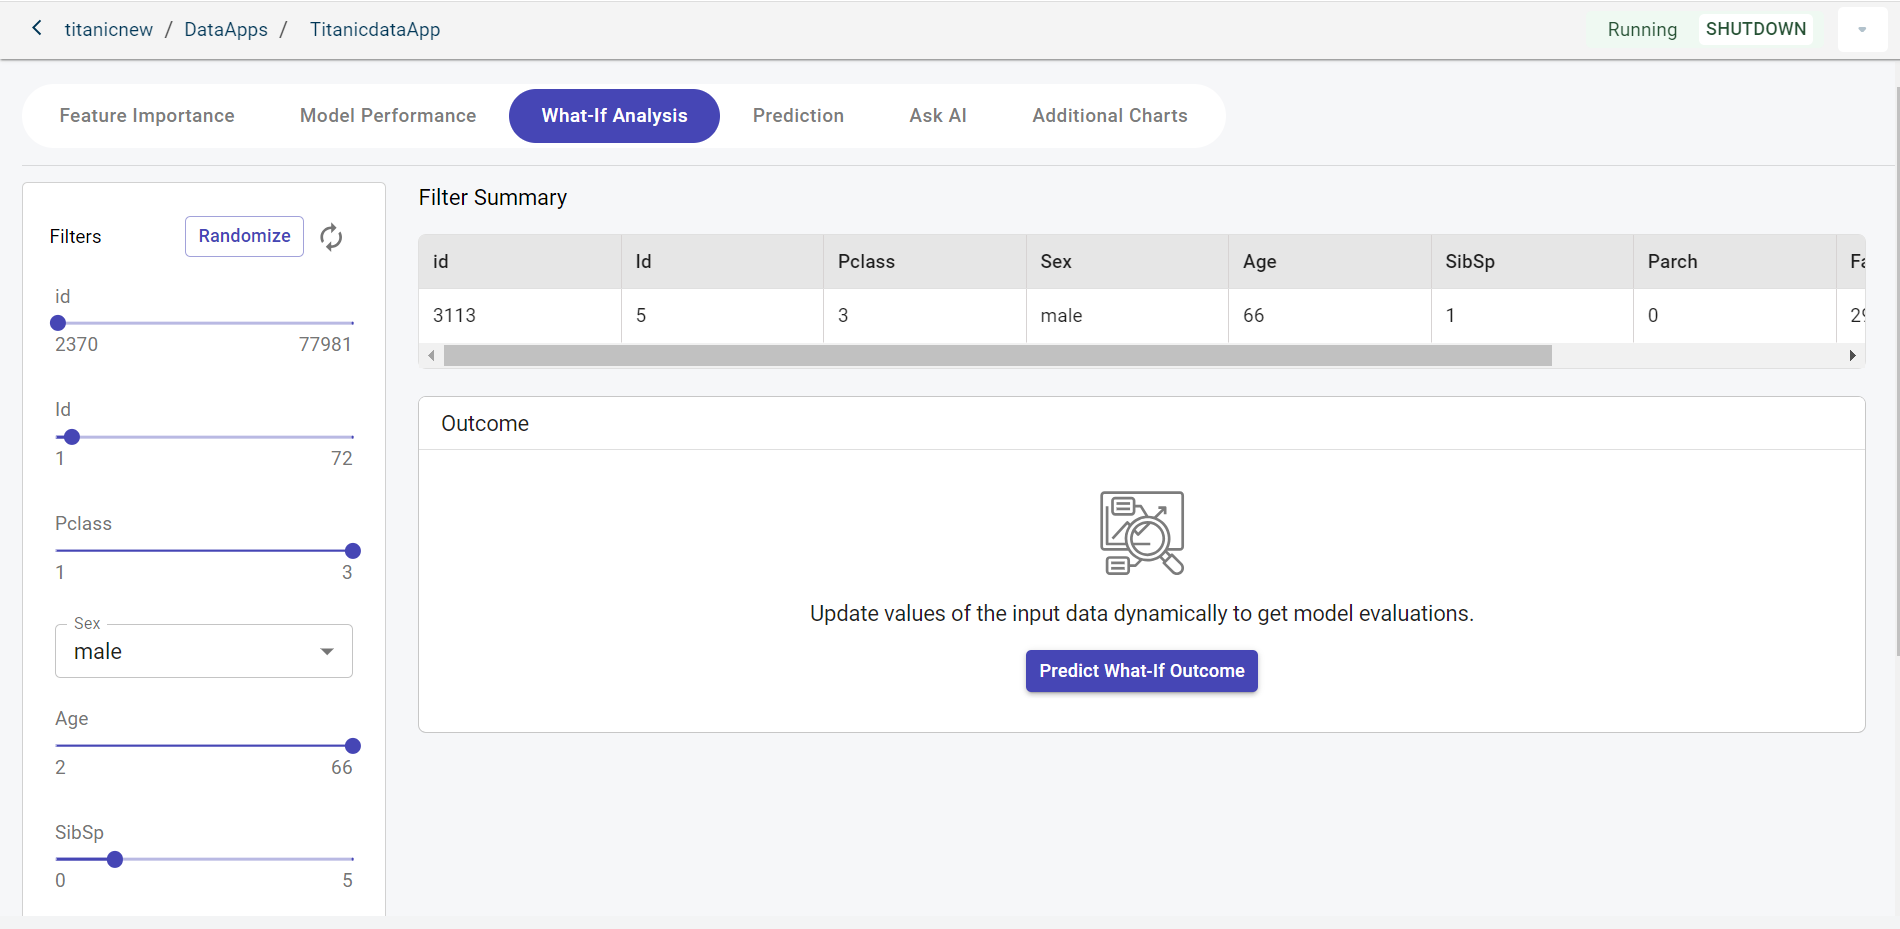
You can use the sliders to change the values or use drop-down to select values and click Predict What-If Outcome to review what the model predicts for the given input values.
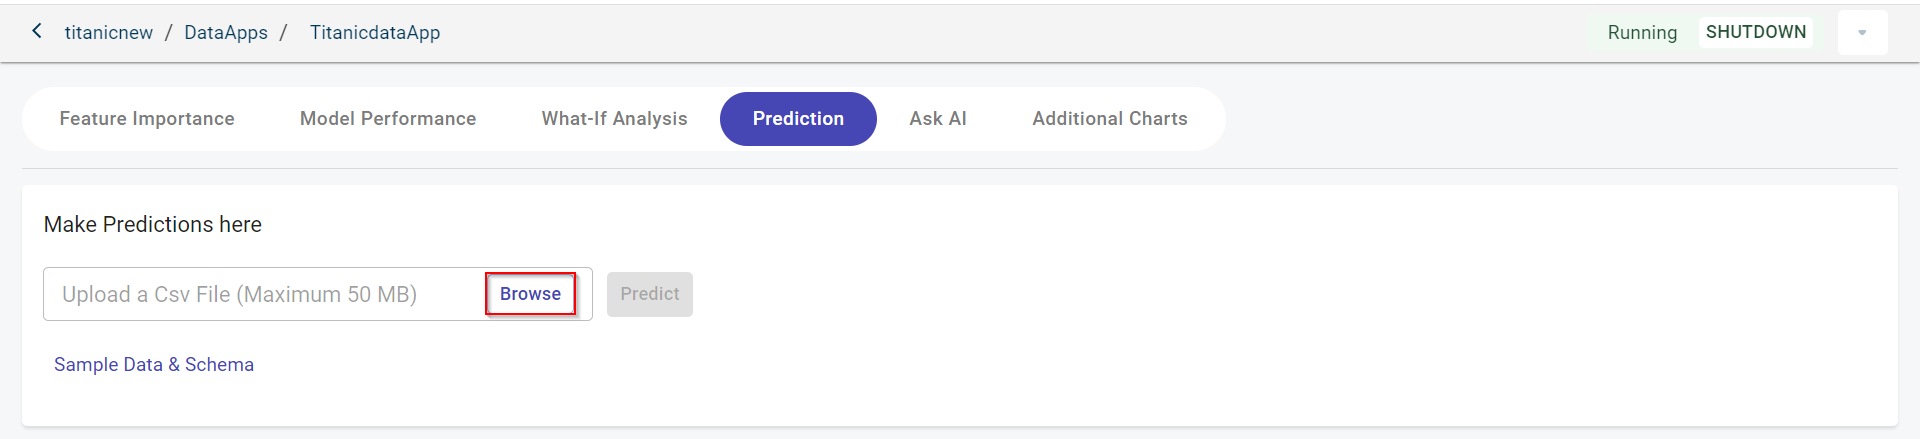
Prediction - You can perform predictions on the uploaded dataset. For more information, see Performing predictions on the uploaded dataset.
Performing predictions on the uploaded dataset
Use this procedure to do the predictions on the new dataset and generate charts using Ask AI.
Click Browse to upload the dataset and obtain predictions generated by the model.
Click Upload File From Local. Once you upload the file, click Close to upload.
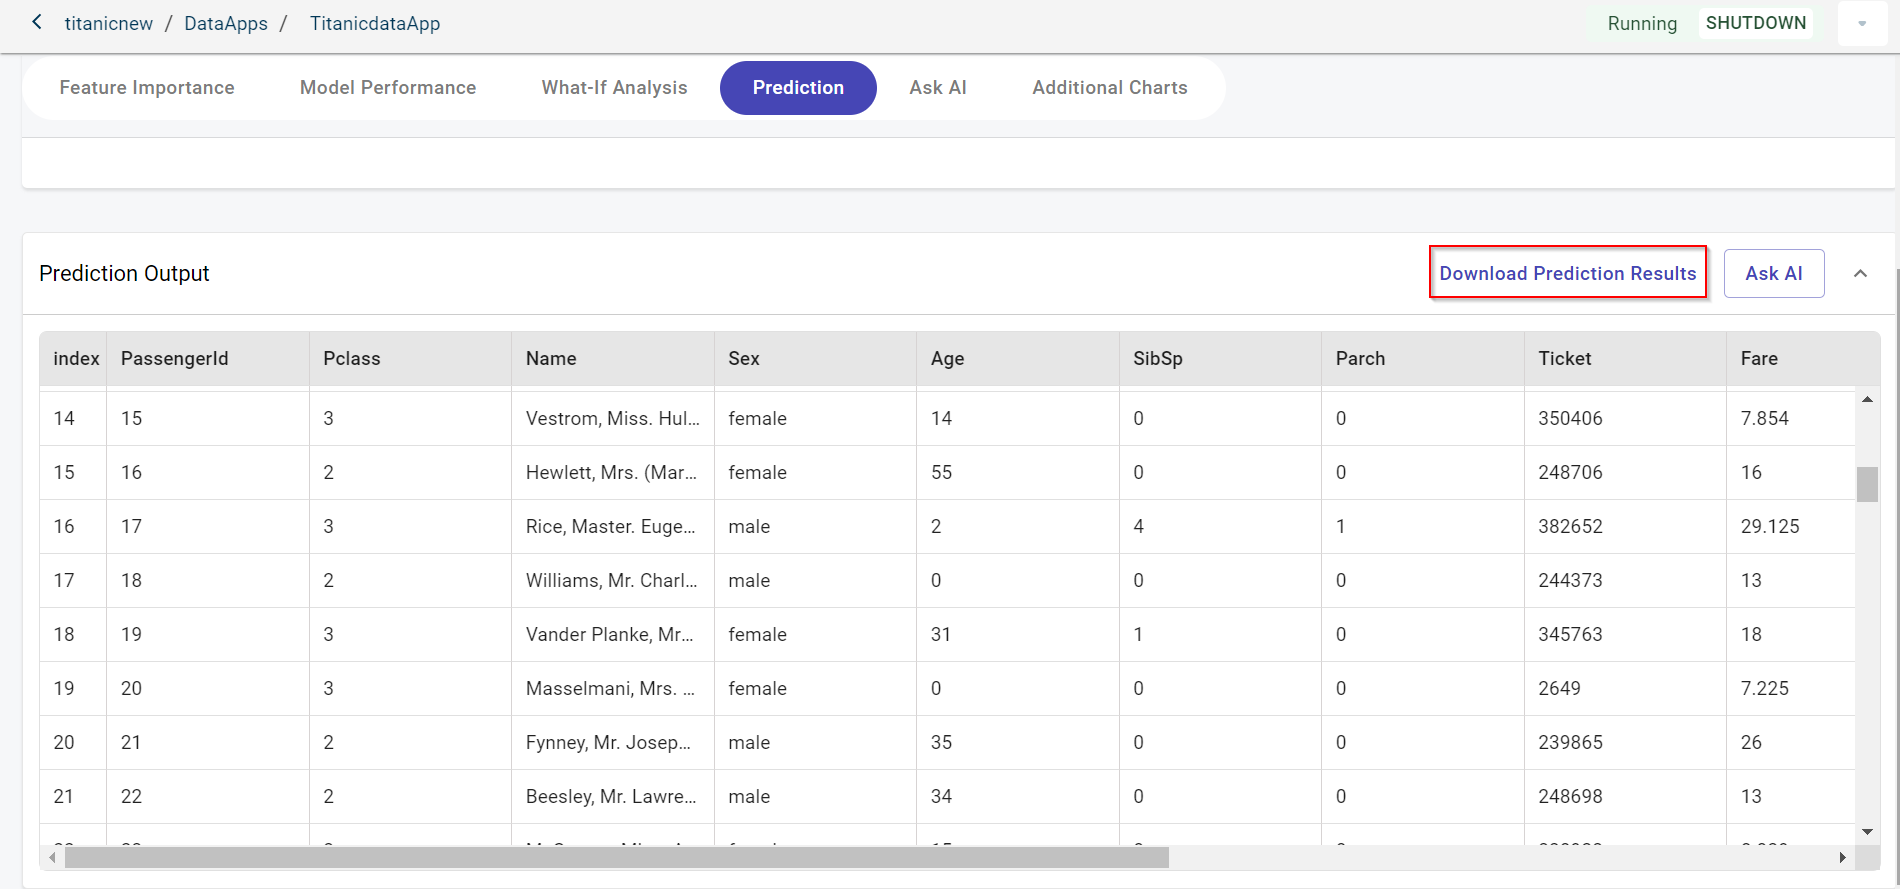
Click Generate Prediction. Once the prediction is done on the dataset, you can download the prediction results, using the Download option.
Note
You can use the Log option to view the detailed records of the execution activity and identify issues.
Click Ask AI button.
Important
Apart from generating charts, you can also perform data transformation operations on the dataset by prompting for the Ask AI.
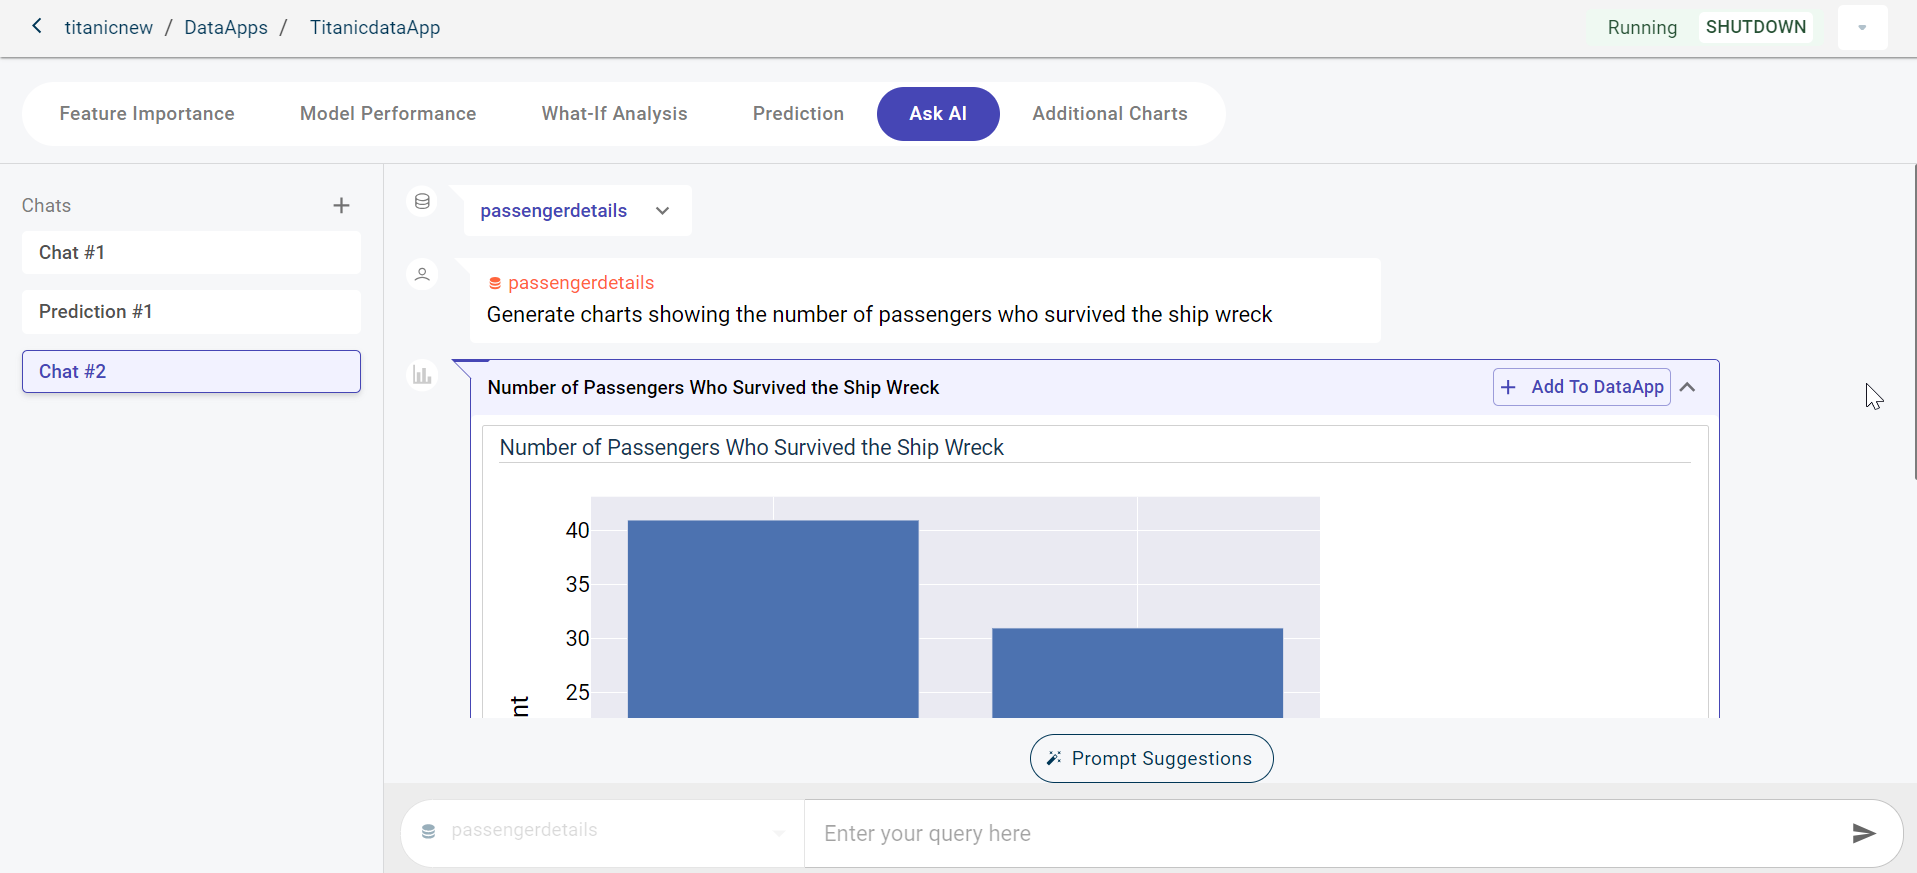
Click +DataApp to add this chart to the dataapp. The Update Name box appears where you can provide the custom name for the chart and click Save.
Click the User Charts tab to view this chart.
Ask AI - You can use the Ask AI feature similar to what you see in AI-assisted recipe to provide text prompt in the chat window and generate the chart outputs on the dataset used for model building. This allows you to generate visualizations and carry out different data pre-processing operations on the selected dataset.
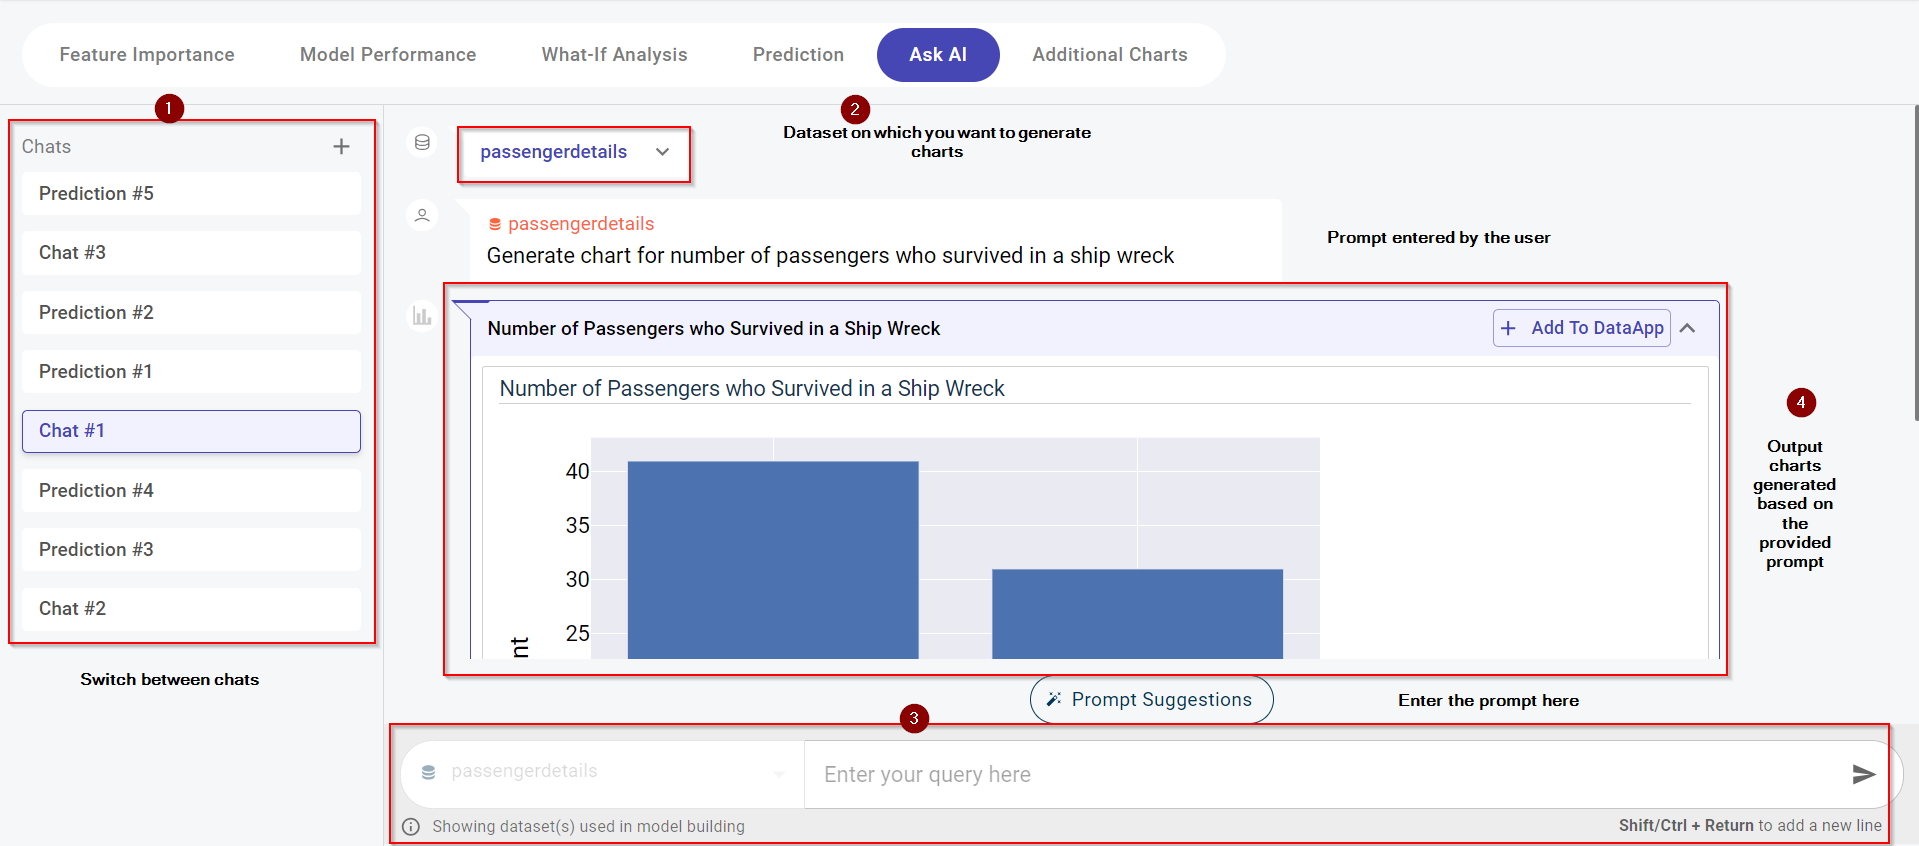
You can add as many chats as you want and switch between the chat windows from the Chat list on the left. The difference between the chat window used for prediction output dataset and dataset used for model building can be see in its chat name on the left.
Perform the following actions clicking the Actions drop-down:
Copy the dataapps URL to share with the other business users, using the Copy option.
Open the dataapps on a new tab, using the Open in New Tab option.
Configure the shutdown time of the DataApp, using the Config option.
View logs of DataApps to debug issues, using the Logs option.
Delete the DataApp that is no longer required, using the Delete option.
Customize the branding appearance of your DataApp, using the Branding option. This opens the Branding modal. Enter your desired title in the DataApp Title field, then use the Upload from Computer option to upload your logo. Once you have added the title and logo, click Save to apply the changes. The customized title and logo will now appear on the AskAI page and will also be visible when the DataApp is opened in a new tab.
Creating Custom DataApp using Project Canvas datasets as input
Use this procedure to create a custom DataApp. Note that these DataApps are model-independent, so no project model is required to create them.
Hover over the menu icon and select Projects
Select the project for which you want to create DataApps and click the DataApps icon from the project level navigation.
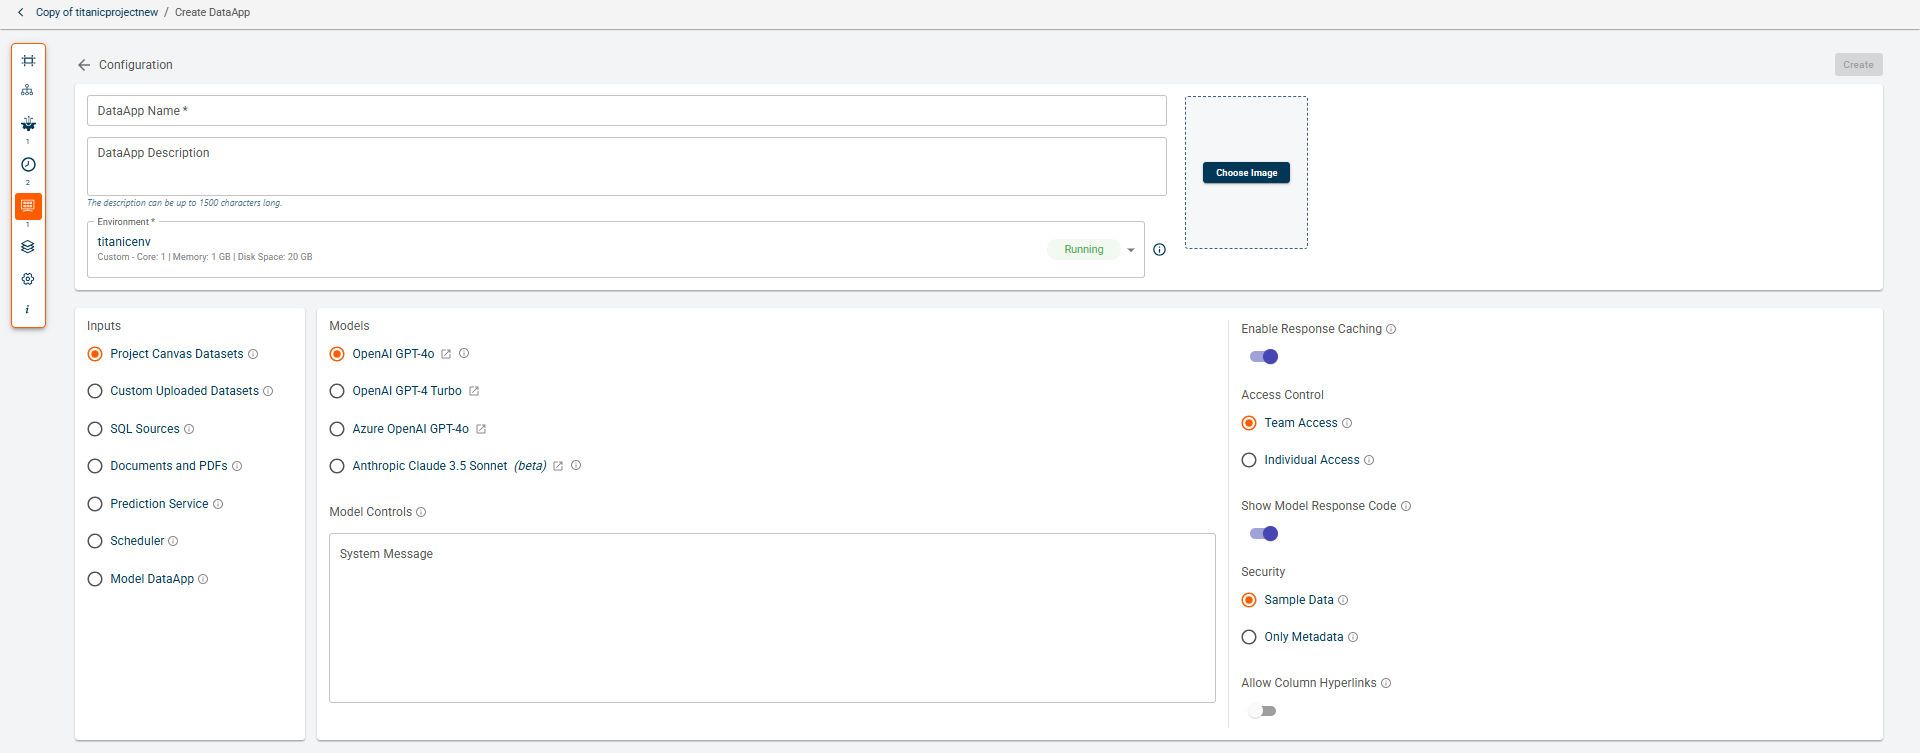
Click the plus icon and select Custom DataApp. This opens the Configuration page.
Specify this information:
- DataApp Name:
The name of the Dataapp.
- DataApp description:
The description of the Dataapp.
- Environment:
By default, the environment selected during project creation is applied. However, you have the flexibility to choose a different environment for running your DataApps.
Click Choose Image to browse and select the image that is visible on the DataApp cards.
Select an input from the Inputs section. Possible options:
Project Canvas Datasets - Use the datasets available in the project and uploaded by the user.
Custom Uploaded Datasets - Use the datasets that are uploaded by the user.
SQL Sources - Use the data that is fetched from the SQL databases.
Documents and PDFs - Use the datasets uploaded in pdf, doc, or docx formats.
Prediction service - Use the prediction service as input
Here we are selecting Project Canvas Datasets as an input option.
Select a model that you want to use in the Custom DataApp. Possible values:
OpenAI GPT-4 Turbo
OpenAI GPT-4o (by default this is selected)
Azure OpenAI GPT-4o
Anthropic Claude 3.5 Sonnet (beta)
Toggle ON the Show Model Response Code option to return the same response for the identical queries despite asking multiple times.
Select Access Control to manage access to chats and charts generated within the DataApp. The available options are:
Team Access: Allows all users within the tenant to view chats and charts in the DataApp.
Individual Access: Restricts visibility of chats and charts to users who created them. For example, if User A creates Chat A and Chart C, only User A can view these.
Select the Security options. Possible values:
Sample Data : The sample of 5 rows of data is shared with the LLM for context.
Only Metadata: Only the column names in the dataset are shared with the LLM for context.
Enter Model controls in the text box to provide specific context to the AI guide. This helps in aligning the AI-generated responses more closely with the user’s particular use case.
Toggle ON the Show Model Response Code option to view the code generated by the model in response to the queries.
Enable Allow Column Hyperlinks to create hyperlinks between columns in related tables.
Add starter prompts to help users get started with predefined queries. To add prompts, see Adding starter prompts in DataApps
Click Create. The DataApp card is created.
Click on the DataApp card to launch the AskAI DataApp. The AskAI chat window appears.
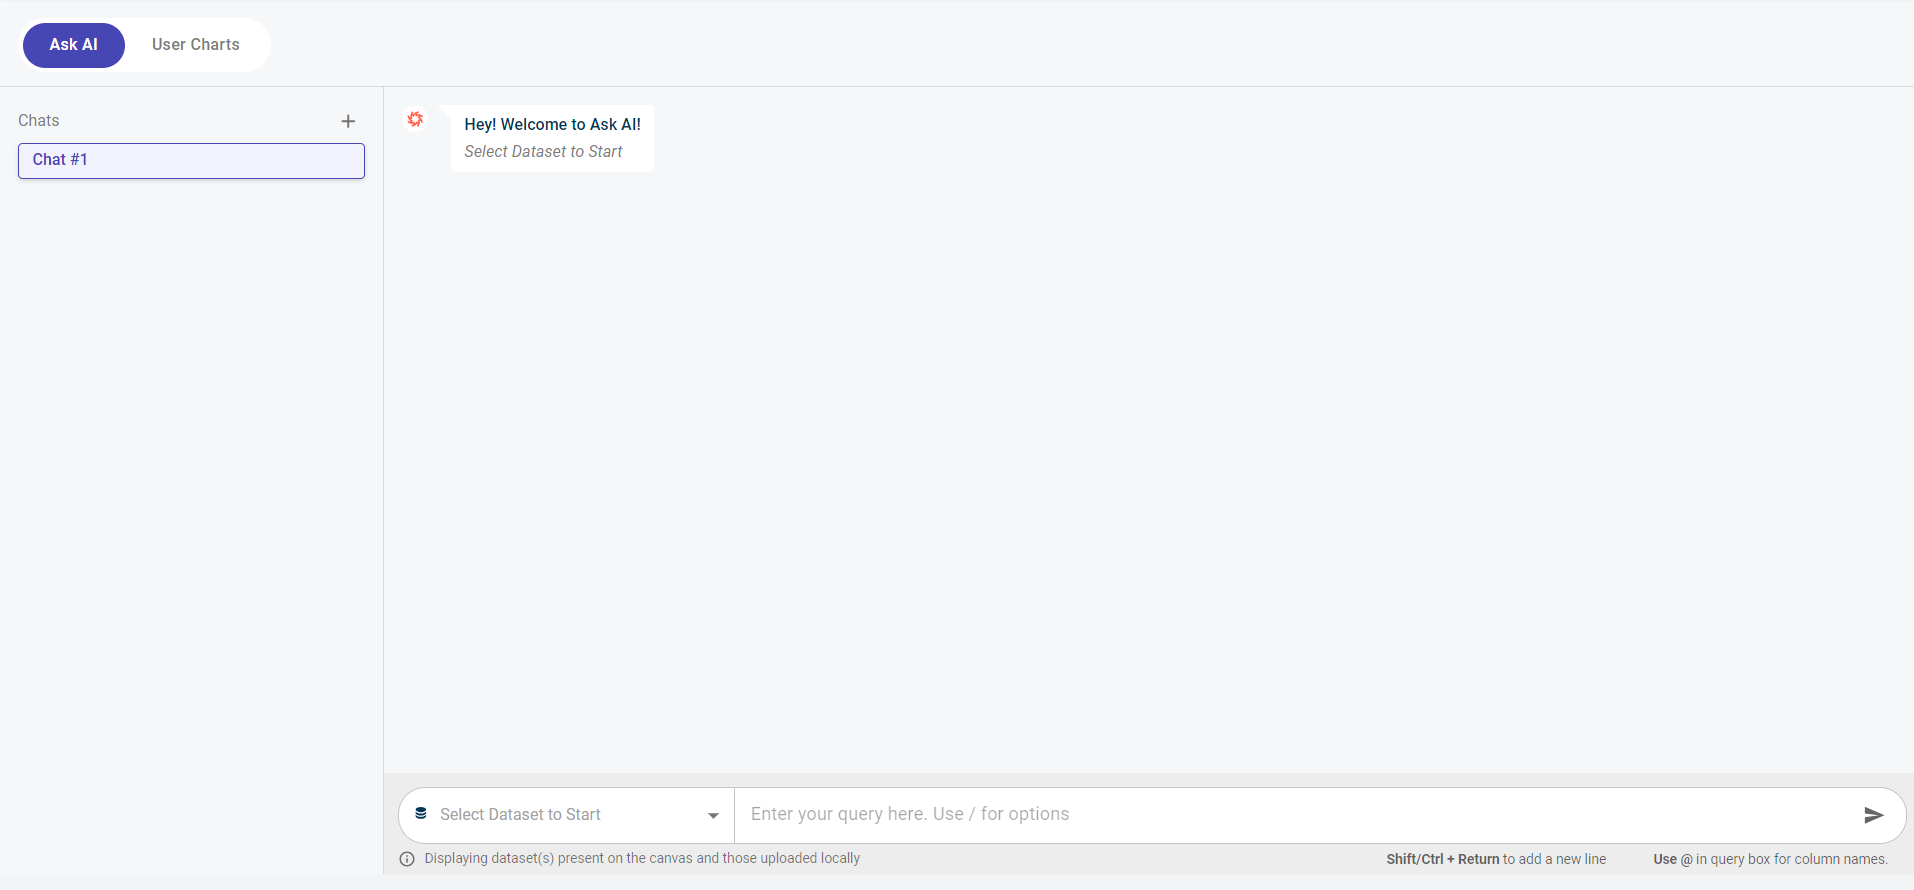
Select the Dataset on which you want to create the DataApp. You can view all the datasets that are on the canvas in the drop-down.
Note
You can also view the +Upload New Datasets option in the datasets drop-down, from where you can upload a new dataset on which you want to run the query using AskAI. Alternatively, click the Select from Artifacts tab to choose a document from the Artifacts folder. You can also use the search box to quickly locate the document you need.
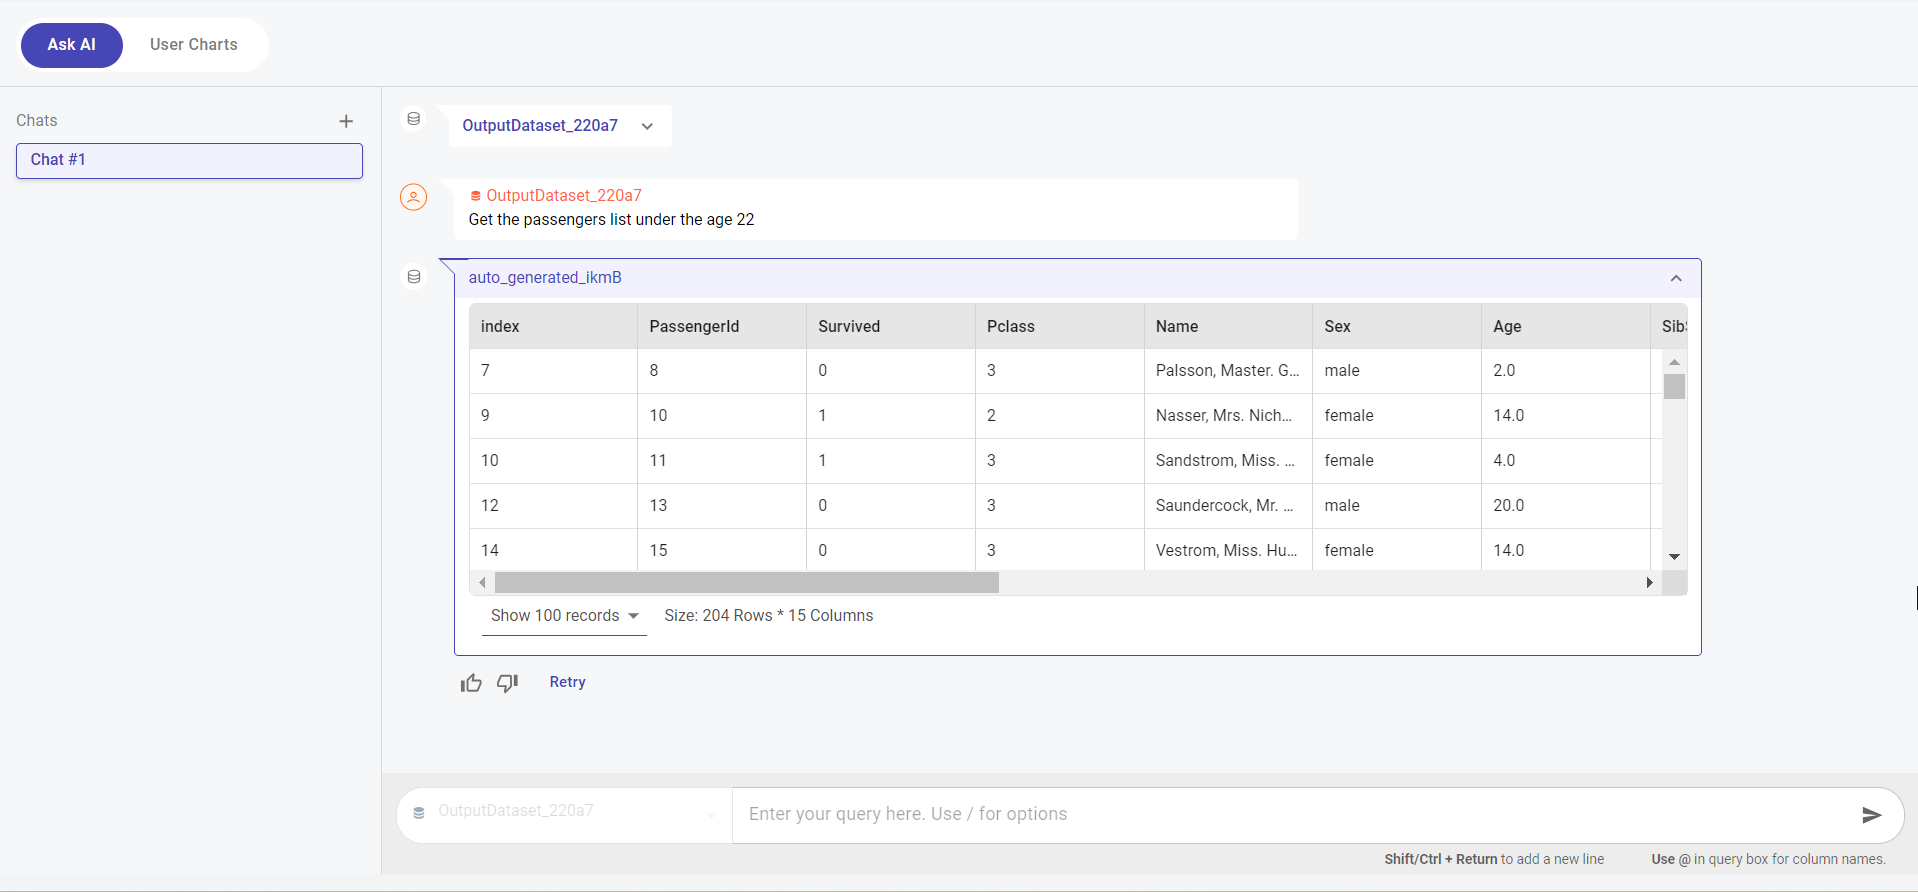
Enter the query in the query box. You can use slash to choose the type of output you want the AI to generate, such as text, dataset, or chart. Once the output is generated, you can:
Copy the answer using the Copy Answer option.
View the generated code by selecting the View Code option.
Get an explanation for each line of code by using the Explain option, which becomes visible only after clicking View Code.
If you have generated a chart using the Ask AI, then you can view the + DataApp option.
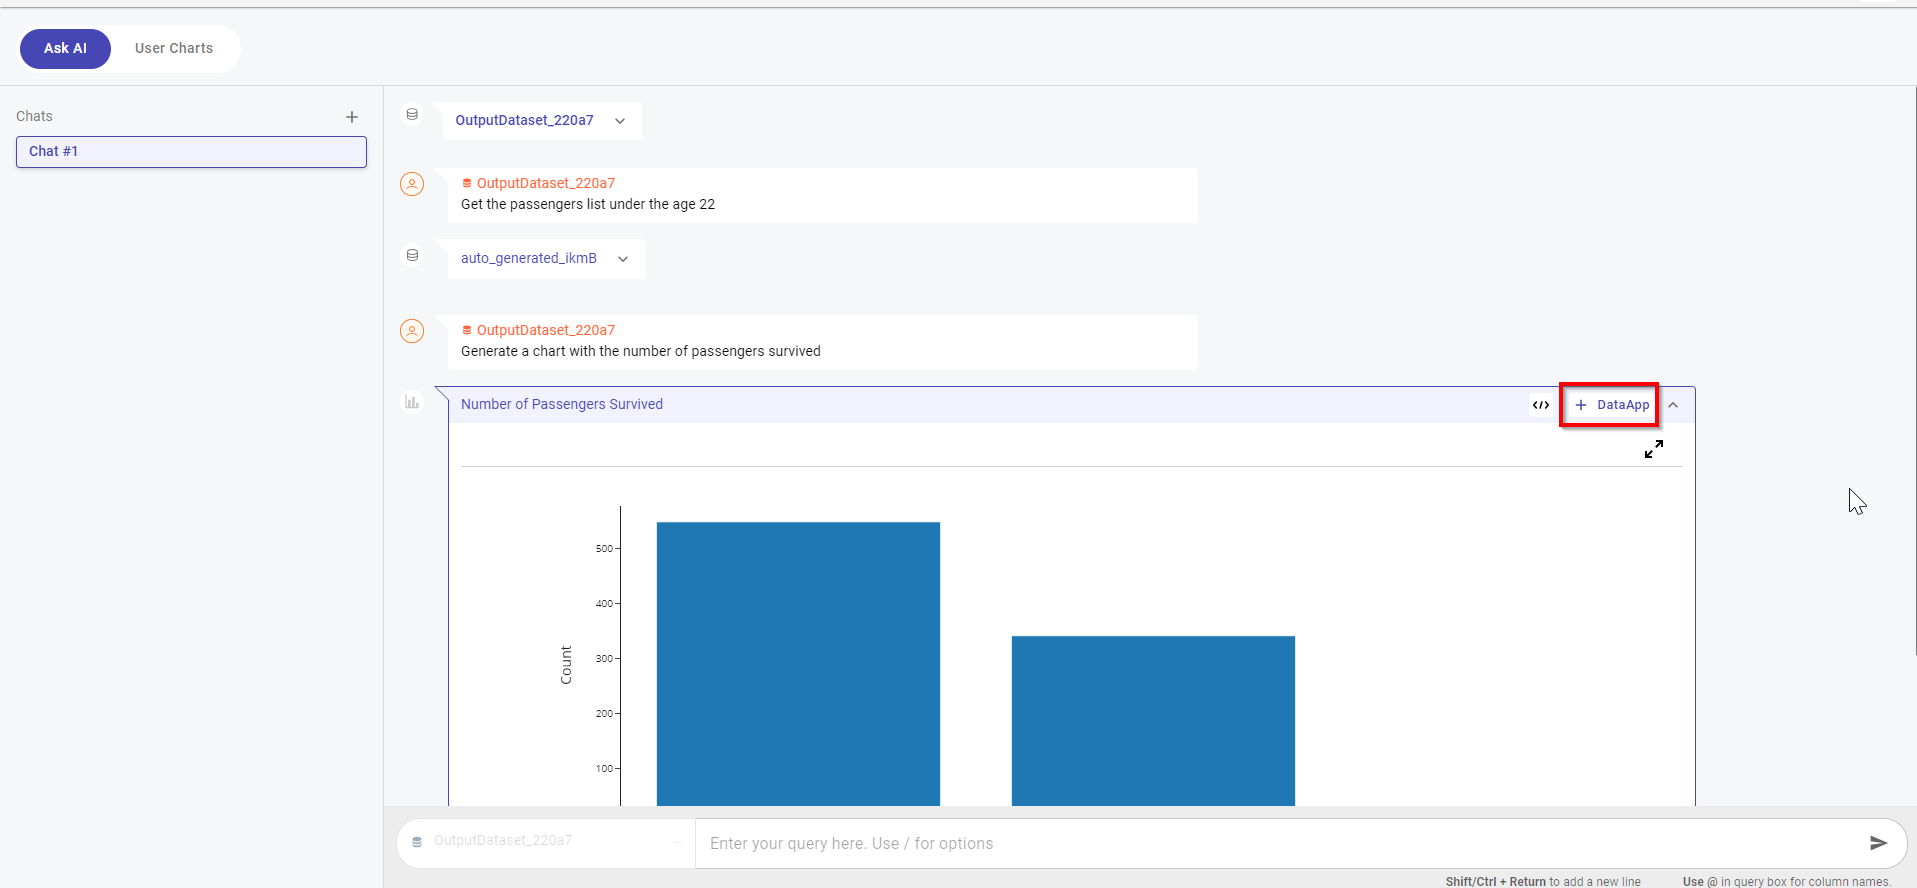
Click + DataApp to add this chart to the dataapp. Clicking this opens the Update Name box where you can provide the custom name for the chart and click Save.
Once a chart is added, you can easily track the total number of charts added under the User Charts tab. An indicator on this tab displays the number of charts.
Click the User Charts tab to view this chart.
Creating Custom DataApp using Datasets as an input
Use this procedure to create a custom DataApp using Datasets an an input. Note that these DataApps are model-independent, so no project model is required to create them.
Hover over the menu icon and select Projects
Select the project for which you want to create DataApps and click the DataApps icon from the project level navigation.
Note
You can also view the +Upload New Datasets option in the datasets drop-down, from where you can upload a new dataset on which you want to run the query using AskAI.
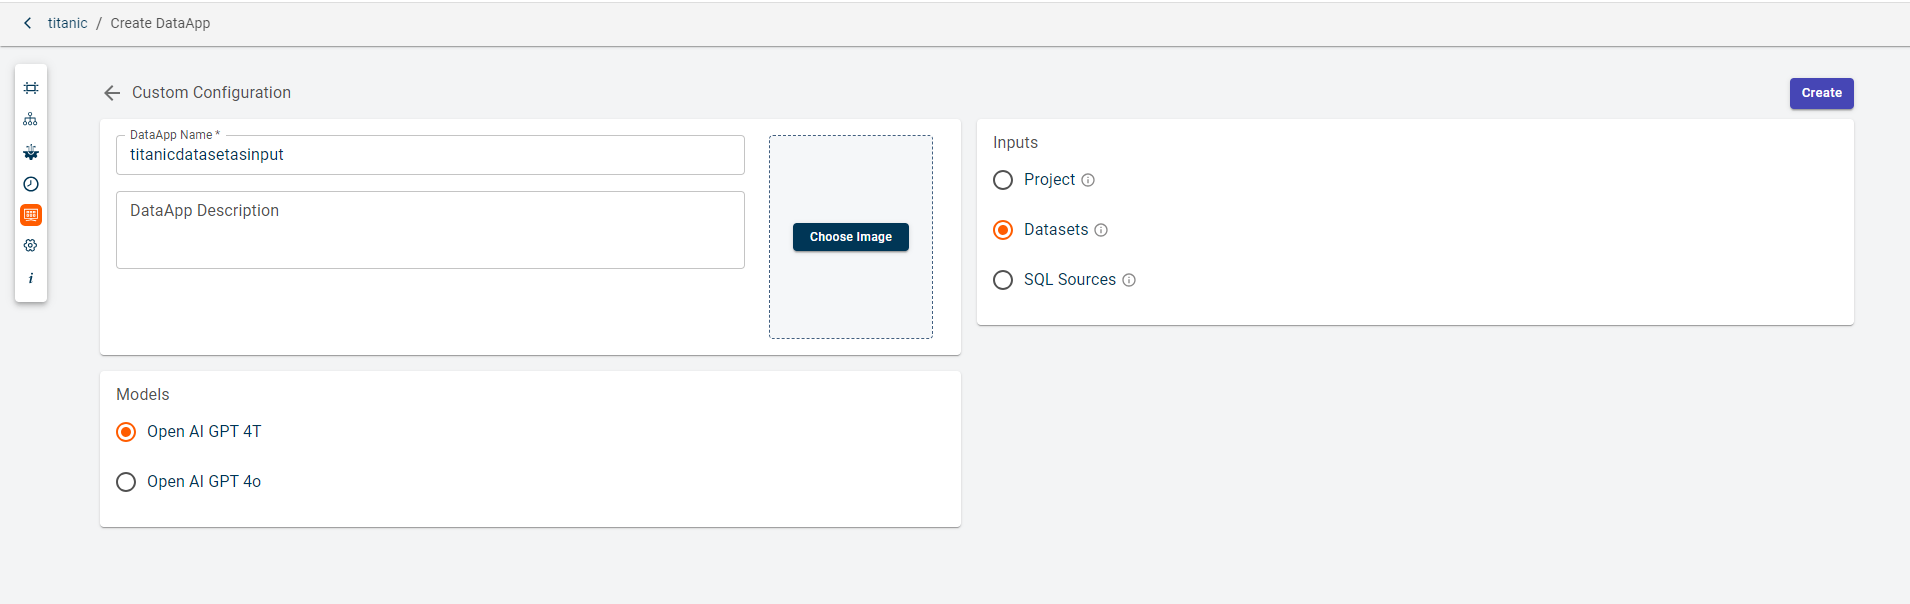
Click the plus icon and select Custom DataApp. This opens the Configuration page.
Specify this information:
- DataApp Name:
The name of the Dataapp.
- DataApp description:
The description of the Dataapp.
- Environment:
By default, the environment selected during project creation is applied. However, you have the flexibility to choose a different environment for running your DataApps.
Click Choose Image to browse and select the image that is visible on the DataApp cards.
Select an input as Custom Uploaded datasets.
Select a model that you want to use in the Custom DataApp. Possible values:
OpenAI GPT-4 Turbo
OpenAI GPT-4o (by default this is selected)
Azure OpenAI GPT-4o
Anthropic Claude 3.5 Sonnet (beta)
Toggle ON the Enable Response Caching option to return the same response for the identical queries despite asking multiple times.
Toggle ON the Show Model Response Code option to view the code generated by the model in response to the queries.
Enable Allow Column Hyperlinks to create hyperlinks between columns in related tables.
Select Access Control to manage access to chats and charts generated within the DataApp. The available options are:
Team Access: Allows all users within the tenant to view chats and charts in the DataApp.
Individual Access: Restricts visibility of chats and charts to users who created them. For example, if User A creates Chat A and Chart C, only User A can view these.
Select the Security options. Possible values:
Sample Data : The sample of 5 rows of data is shared with the LLM for context.
Only Metadata: Only the column names in the dataset are shared with the LLM for context.
Enter Model controls in the text box to provide specific context to the AI guide. This helps in aligning the AI-generated responses more closely with the user’s particular use case.
Add starter prompts to help users get started with predefined queries. To add prompts, see Adding starter prompts in DataApps
Click Create. The DataApp card is created.
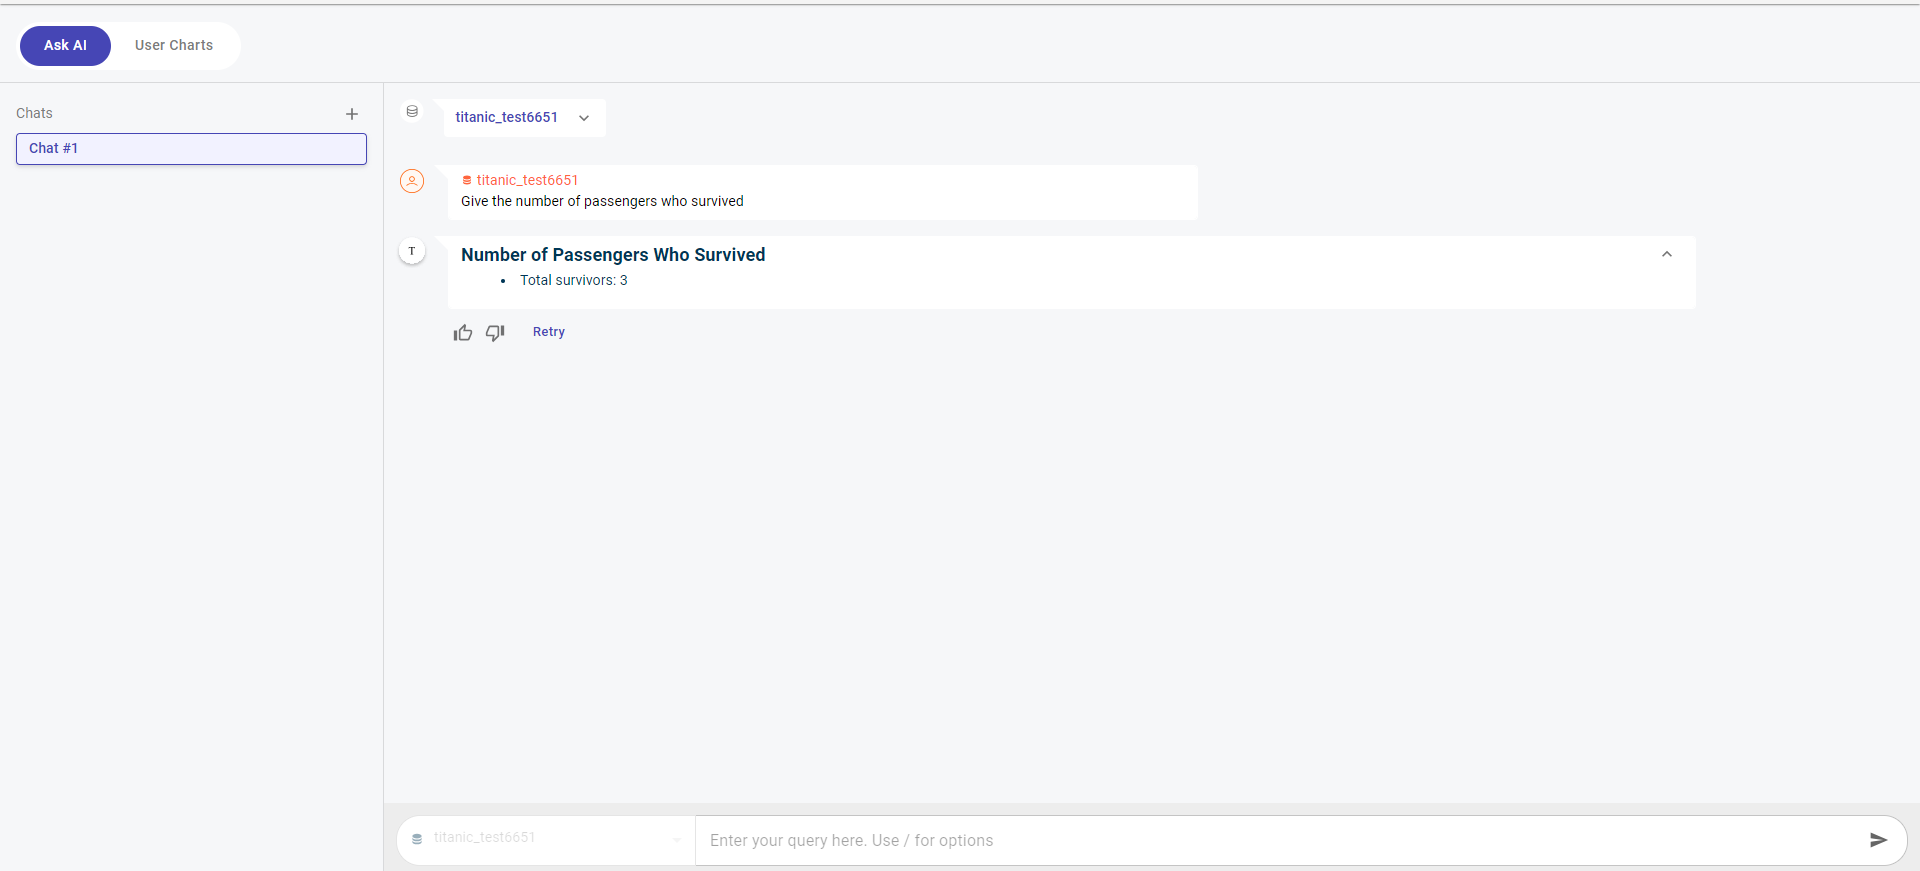
Click on the DataApp card to launch the AskAI DataApp. The AskAI chat window appears.
Click Select Dataset to Start in the prompt box drop-down and select +Upload New Datasets. This opens the Upload Dataset(s) window.
Click Upload Files From Local to upload the file and then click Upload. Once done, click Done.
Enter the query in the query box. You can use slash to choose the type of output you want the AI to generate, such as text, dataset, or chart. Once the output is generated, you can:
Copy the answer using the Copy Answer option.
View the generated code by selecting the View Code option.
Get an explanation for each line of code by using the Explain option, which becomes visible only after clicking View Code.
If you have generated a chart using the Ask AI, then you can view the + DataApp option.
Click + DataApp to add this chart to the dataapp. Clicking this opens the Update Name box where you can provide the custom name for the chart and click Save.
Once a chart is added, you can easily track the total number of charts added under the User Charts tab. An indicator on this tab displays the number of charts.
Click the User Charts tab to view this chart.
Note
You can upload and run queries on as many datasets as you want. To upload a new dataset, click the plus button next to Charts on the left side.
Creating Custom DataApp using SQL database as an input
Use this procedure to create a custom DataApp using SQL database an an input. Note that these DataApps are model-independent, so no project model is required to create them.
Hover over the menu icon and select Projects
Select the project for which you want to create DataApps and click the DataApps icon from the project level navigation.
Note
You can also view the +Upload New Datasets option in the datasets drop-down, from where you can upload a new dataset on which you want to run the query using AskAI.
Click the plus icon. This takes you to the Create DataApp page.
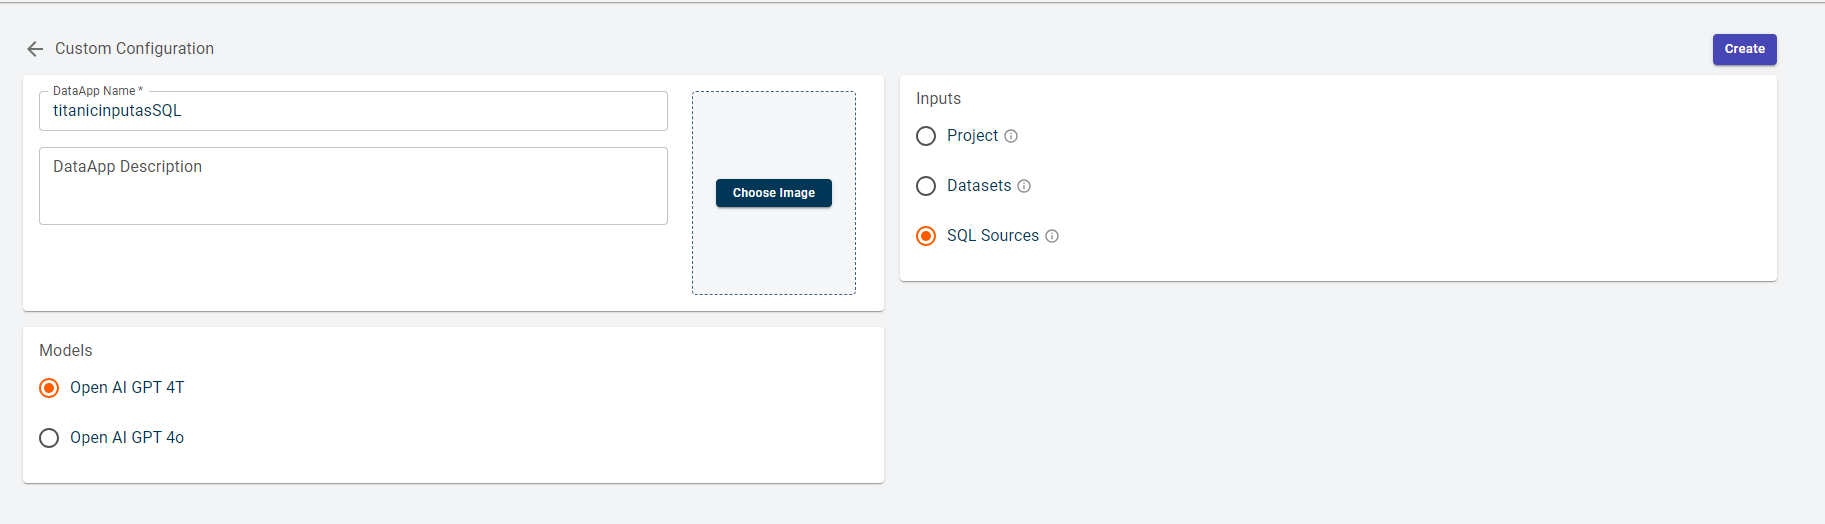
Specify this information:
- DataApp Name:
The name of the Dataapp.
- DataApp description:
The description of the Dataapp.
- Environment:
By default, the environment selected during project creation is applied. However, you have the flexibility to choose a different environment for running your DataApps.
Click Choose Image to browse and select the image that is visible on the DataApp cards.
Select an input as SQL Sources.
Select a model that you want to use in the Custom DataApp. Possible values:
OpenAI GPT-4 Turbo
OpenAI GPT-4o (by default this is selected)
Azure OpenAI GPT-4o
Anthropic Claude 3.5 Sonnet (beta)
Toggle ON the Enable Response Caching option to return the same response for the identical queries despite asking multiple times.
Select Access Control to manage access to chats and charts generated within the DataApp. The available options are:
Team Access: Allows all users within the tenant to view chats and charts in the DataApp.
Individual Access: Restricts visibility of chats and charts to users who created them. For example, if User A creates Chat A and Chart C, only User A can view these.
Select the Security options. Possible values:
Sample Data : The sample of 5 rows of data is shared with the LLM for context.
Only Metadata: Only the column names in the dataset are shared with the LLM for context.
Enter Model controls in the text box to provide specific context to the AI guide. This helps in aligning the AI-generated responses more closely with the user’s particular use case
Add starter prompts to help users get started with predefined queries. To add prompts, see Adding starter prompts in DataApps
Click Create. The DataApp card is created.
Click on the DataApp card to launch the AskAI DataApp. The AskAI chat window appears.
Click Select Data Connector drop-down in the prompt box. This opens the Select Data Connector window.
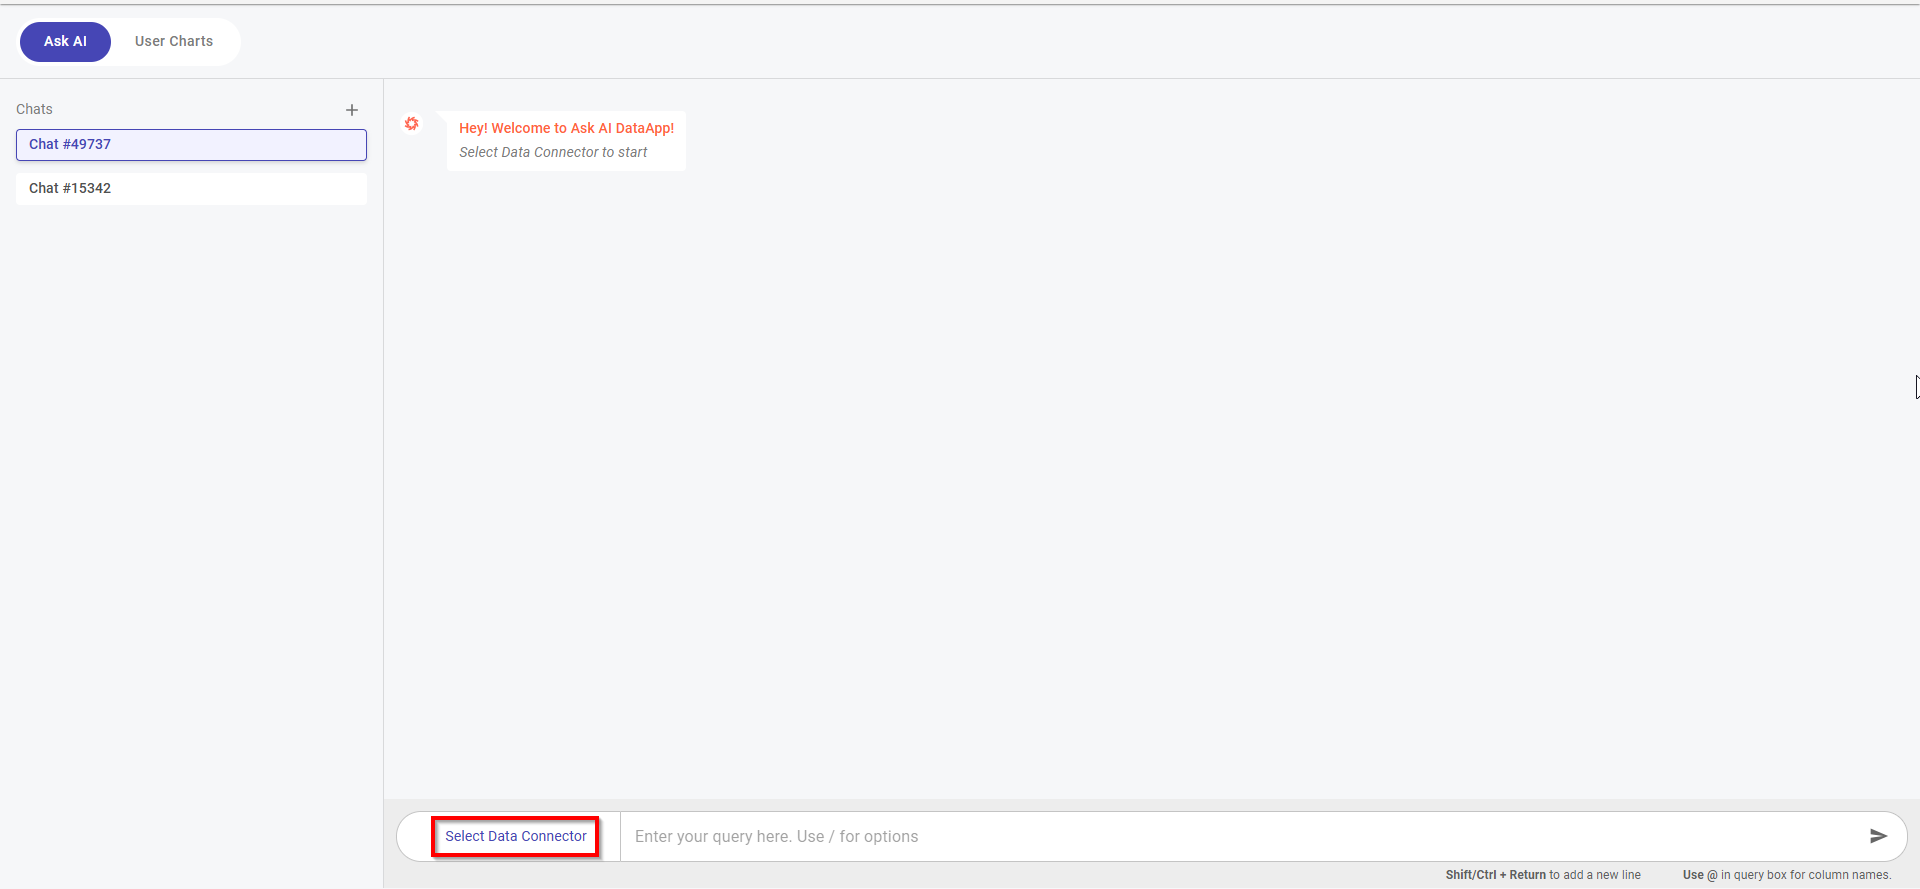
Select the connector from which you can to fetch the data.
Note
You need to first configure the SQL connectors on the Connectors page to view here in the connectors list.
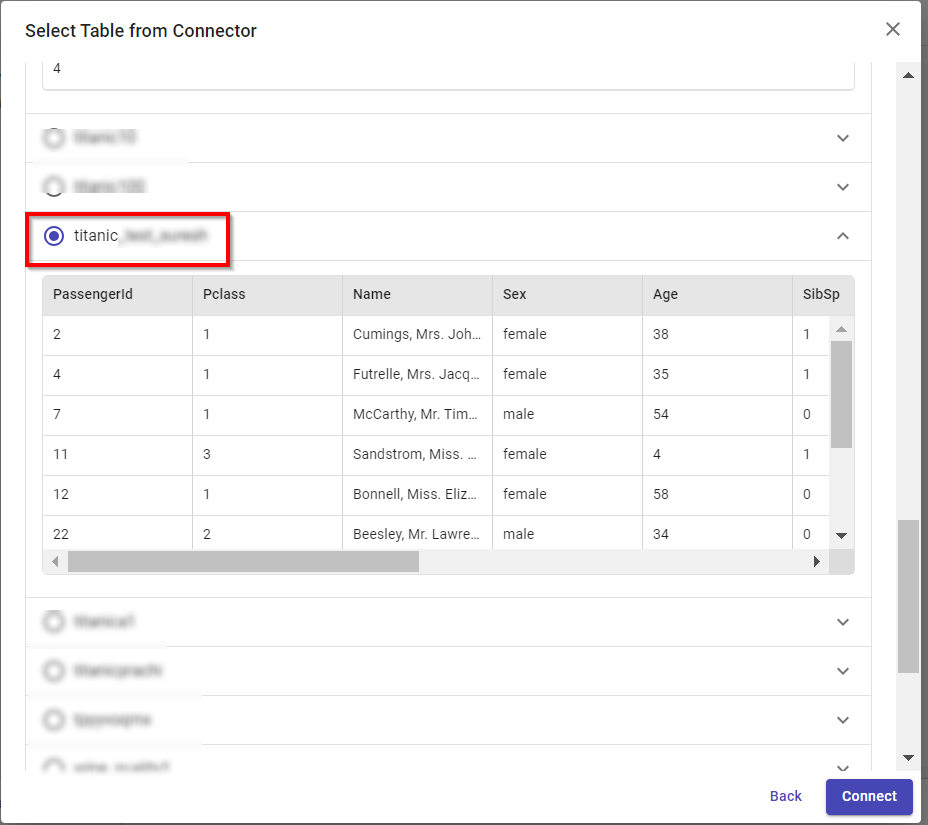
Click Next. This opens the Select Table from Connector window.
Select the check boxes corresponding to the tables from which you want to fetch data. Only four tables can be selected at a time.
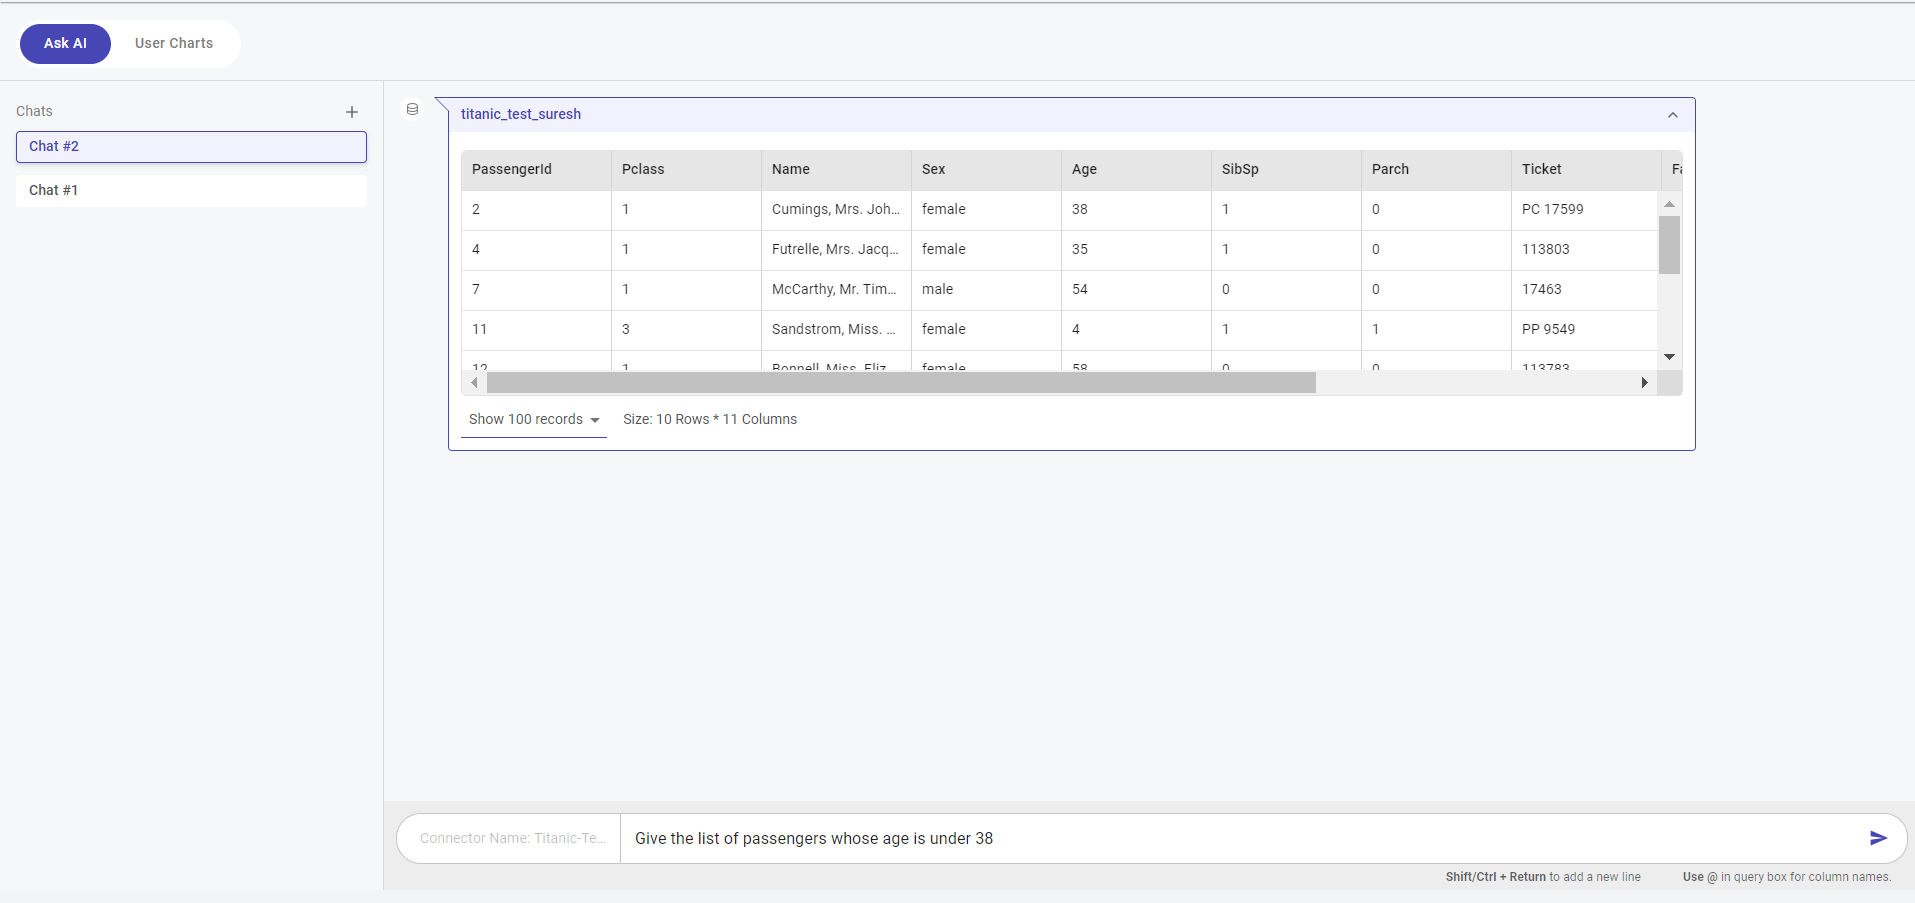
Click Connect to connect to the connector and fetch data. You can view the data fetched from the table on the chat window.
Enter the query in the query box. You can use slash to choose the type of output you want the AI to generate, such as text, dataset, or chart. Once the output is generated, you can:
Copy the answer using the Copy Answer option.
View the generated code by selecting the View Code option.
Get an explanation for each line of code by using the Explain option, which becomes visible only after clicking View Code.
If you have generated a chart using the Ask AI, then you can view the + DataApp option.
Click + DataApp to add this chart to the dataapp. Clicking this opens the Update Name box where you can provide the custom name for the chart and click Save.
Once a chart is added, you can easily track the total number of charts added under the User Charts tab. An indicator on this tab displays the number of charts.
Click the User Charts tab to view this chart.
Note
You can upload and run queries on as many datasets as you want. To upload a new dataset, click the plus button next to Charts on the left side.
Creating Custom DataApp using Documents and PDFs as an input
Use this procedure to create a custom DataApp using documents and PDFs an an input. Note that these DataApps are model-independent, so no project model is required to create them.
Hover over the menu icon and select Projects
Select the project for which you want to create DataApps and click the DataApps icon from the project level navigation.
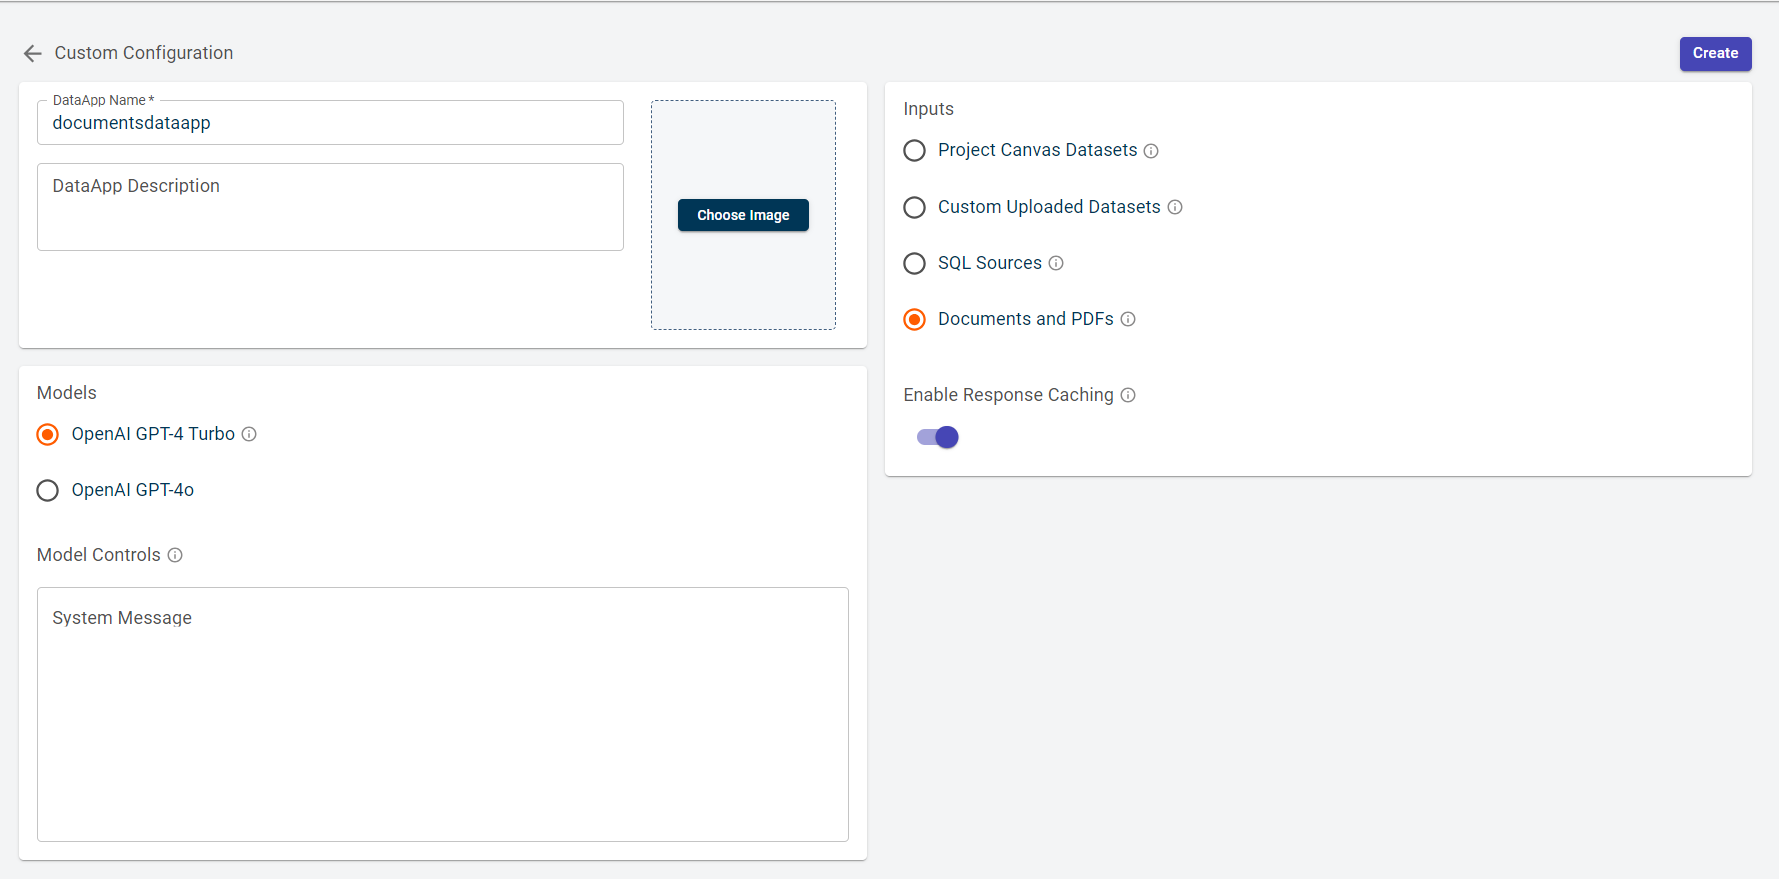
Click the plus icon and select Custom DataApp. This opens the Configuration page.
Specify this information:
- DataApp Name:
The name of the Dataapp.
- DataApp description:
The description of the Dataapp.
- Environment:
By default, the environment selected during project creation is applied. However, you have the flexibility to choose a different environment for running your DataApps.
Click Choose Image to browse and select the image that is visible on the DataApp cards.
Select an input as Documents and PDFs.
Toggle ON the Enable Response Caching option to return the same response for the identical queries despite asking multiple times.
Toggle ON the Show Model Response Code option to view the code generated by the model in response to the queries.
Select Access Control to manage access to chats and charts generated within the DataApp. The available options are:
Team Access: Allows all users within the tenant to view chats and charts in the DataApp.
Individual Access: Restricts visibility of chats and charts to users who created them. For example, if User A creates Chat A and Chart C, only User A can view these.
Enter Model controls in the text box to provide specific context to the AI guide. This helps in aligning the AI-generated responses more closely with the user’s particular use case
Select a model that you want to use in the Custom DataApp. Possible values:
OpenAI GPT-4 Turbo
OpenAI GPT-4o (by default this is selected)
Add starter prompts to help users get started with predefined queries. To add prompts, see Adding starter prompts in DataApps
Click Create. The DataApp card is created.
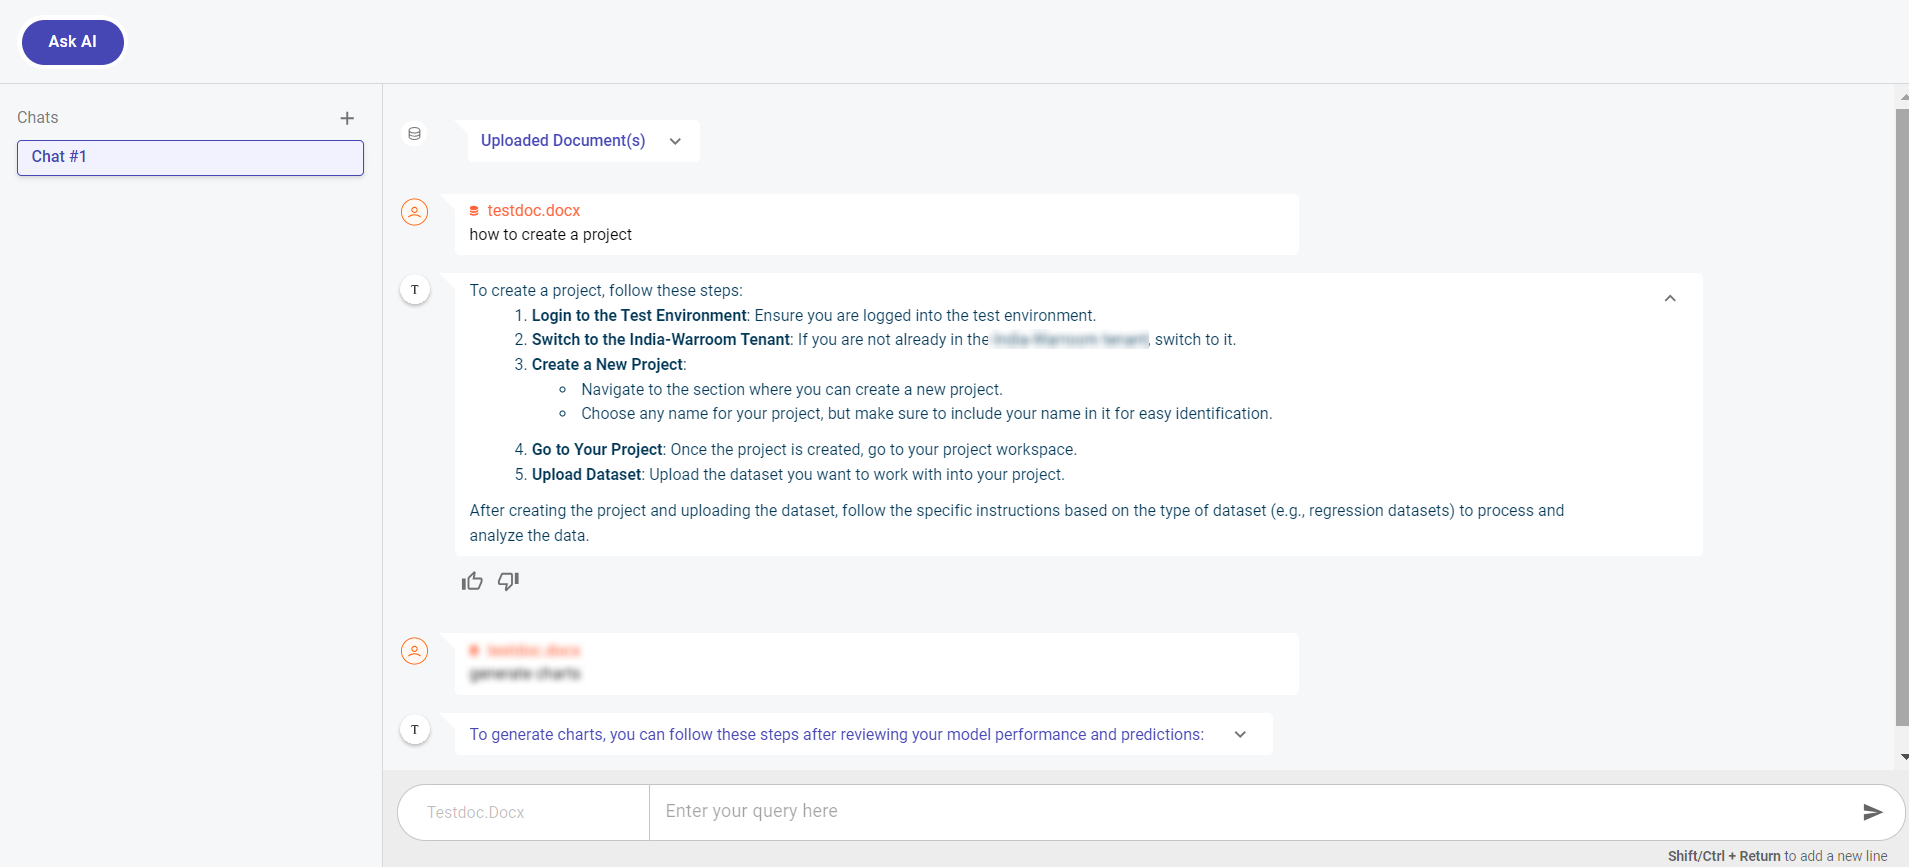
Click on the DataApp card to launch the AskAI DataApp. The AskAI chat window appears.
To upload documents, click Upload Documents, which supports formats such as PDF, DOC, DOCX, TXT, and Markdown. This option allows you to browse and upload files directly from your local system. Once uploaded, you can begin querying using AskAI.You can upload up to 50 documents at a time.
The Recent Documents tab displays recently uploaded documents, while the Select from Artifacts tab shows a list of folders in the Artifacts library. Clicking on a folder shows the files within it, allowing you to select the desired file for querying. However, only artifact files in PDF, DOC, DOCX, TXT, or Markdown formats can be selected for this purpose.
Enter the query in the query box. The generated output will be in the text format. You can:
Copy the answer using the Copy Answer option.
View the generated code by selecting the View Code option.
Get an explanation for each line of code by using the Explain option, which becomes visible only after clicking View Code.
Creating Custom DataApp using Prediction Service as Input Type
Use this procedure to create a custom DataApp using prediction service an an input.
Hover over the menu icon and select Projects
Select the project for which you want to create DataApps and click the DataApps icon from the project level navigation.
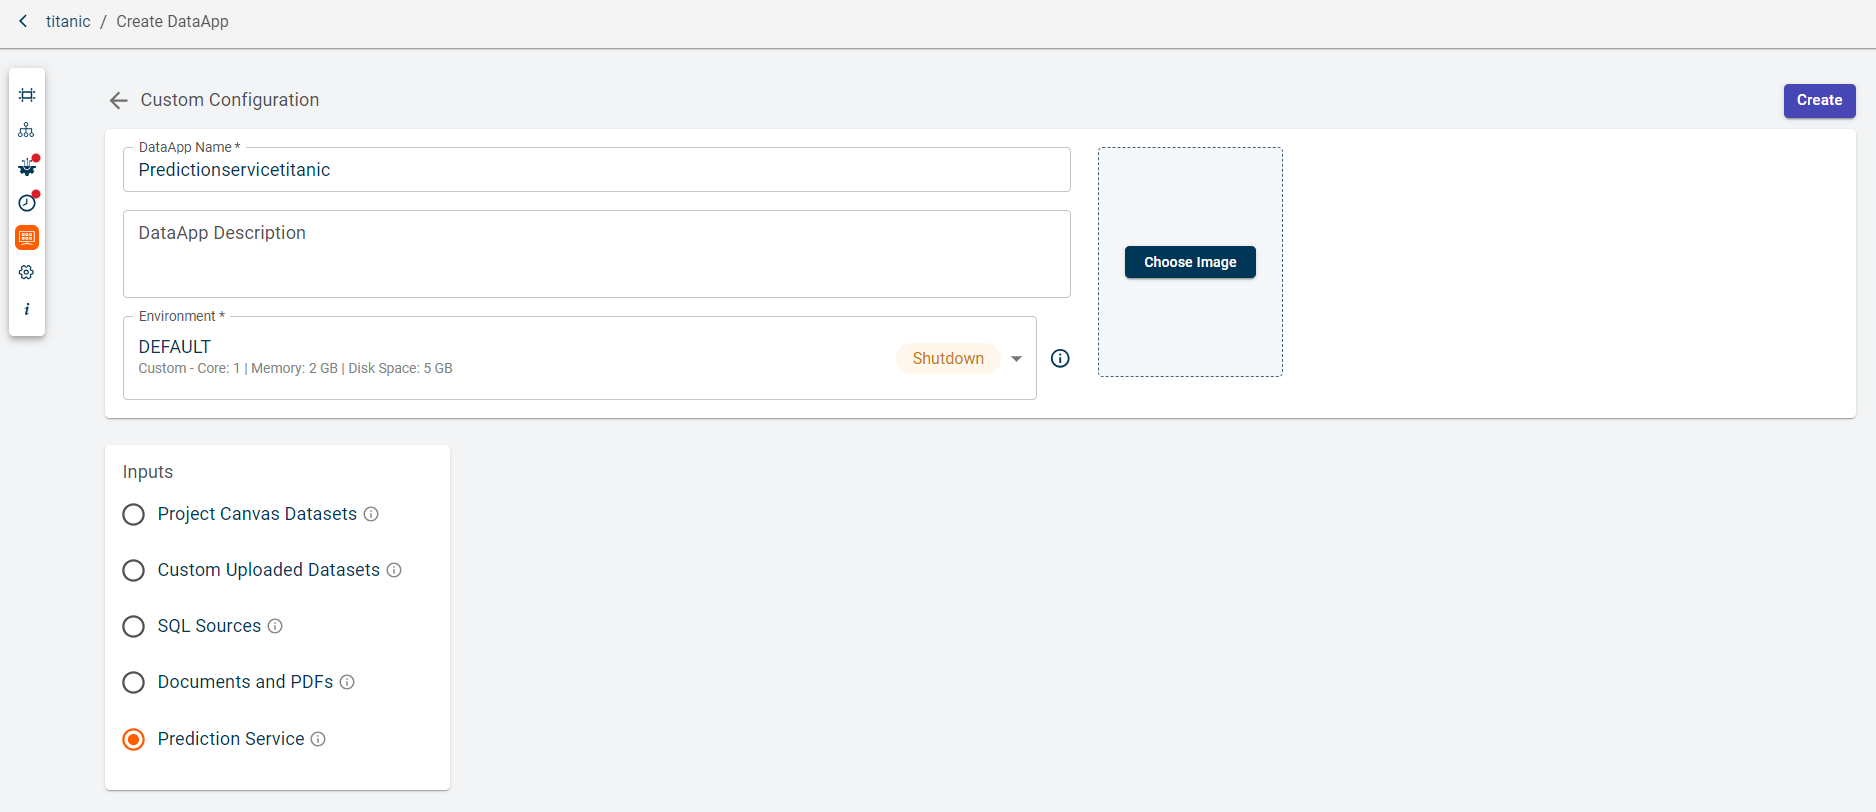
Click the plus icon. This takes you to the Create DataApp page.
Specify this information:
- DataApp Name:
The name of the Dataapp.
- DataApp description:
The description of the Dataapp.
- Environment:
By default, the environment selected during project creation is applied. However, you have the flexibility to choose a different environment for running your DataApps.
Click Choose Image to browse and select the image that is visible on the DataApp cards.
Select an input as Prediction Service.
Select Access Control to manage access to chats and charts generated within the DataApp. The available options are:
Team Access: Allows all users within the tenant to view chats and charts in the DataApp.
Individual Access: Restricts visibility of chats and charts to users who created them. For example, if User A creates Chat A and Chart C, only User A can view these.
Toggle ON the Show Model Response Code option to view the code generated by the model in response to the queries.
Enter Model controls in the text box to provide specific context to the AI guide. This helps in aligning the AI-generated responses more closely with the user’s particular use case.
Add starter prompts to help users get started with predefined queries. To add prompts, see Adding starter prompts in DataApps
Click Create. The DataApp card is created and redirects you to the AskAI tab.
Select the prediction service from the list. You can only view the prediction services created in this project. Once the prediction service is selected, you can start asking the questions to the AskAI
Enter the query in the query box. The generated output will be in the text format. You can:
Copy the answer using the Copy Answer option.
View the generated code by selecting the View Code option.
Get an explanation for each line of code by using the Explain option, which becomes visible only after clicking View Code.
Creating Custom DataApp using Scheduler as an input
Use this procedure to create a custom DataApp using job an an input. Note that these DataApps are model-independent, so no project model is required to create this type of custom DataApp.
Note
Ensure that at least one job has been created and run successfully, with datasets in a built state. Without a successful job run, the datasets will not be available for selection or for executing prompts.
Hover over the menu icon and select Projects
Select the project for which you want to create DataApps and click the DataApps icon from the project level navigation.
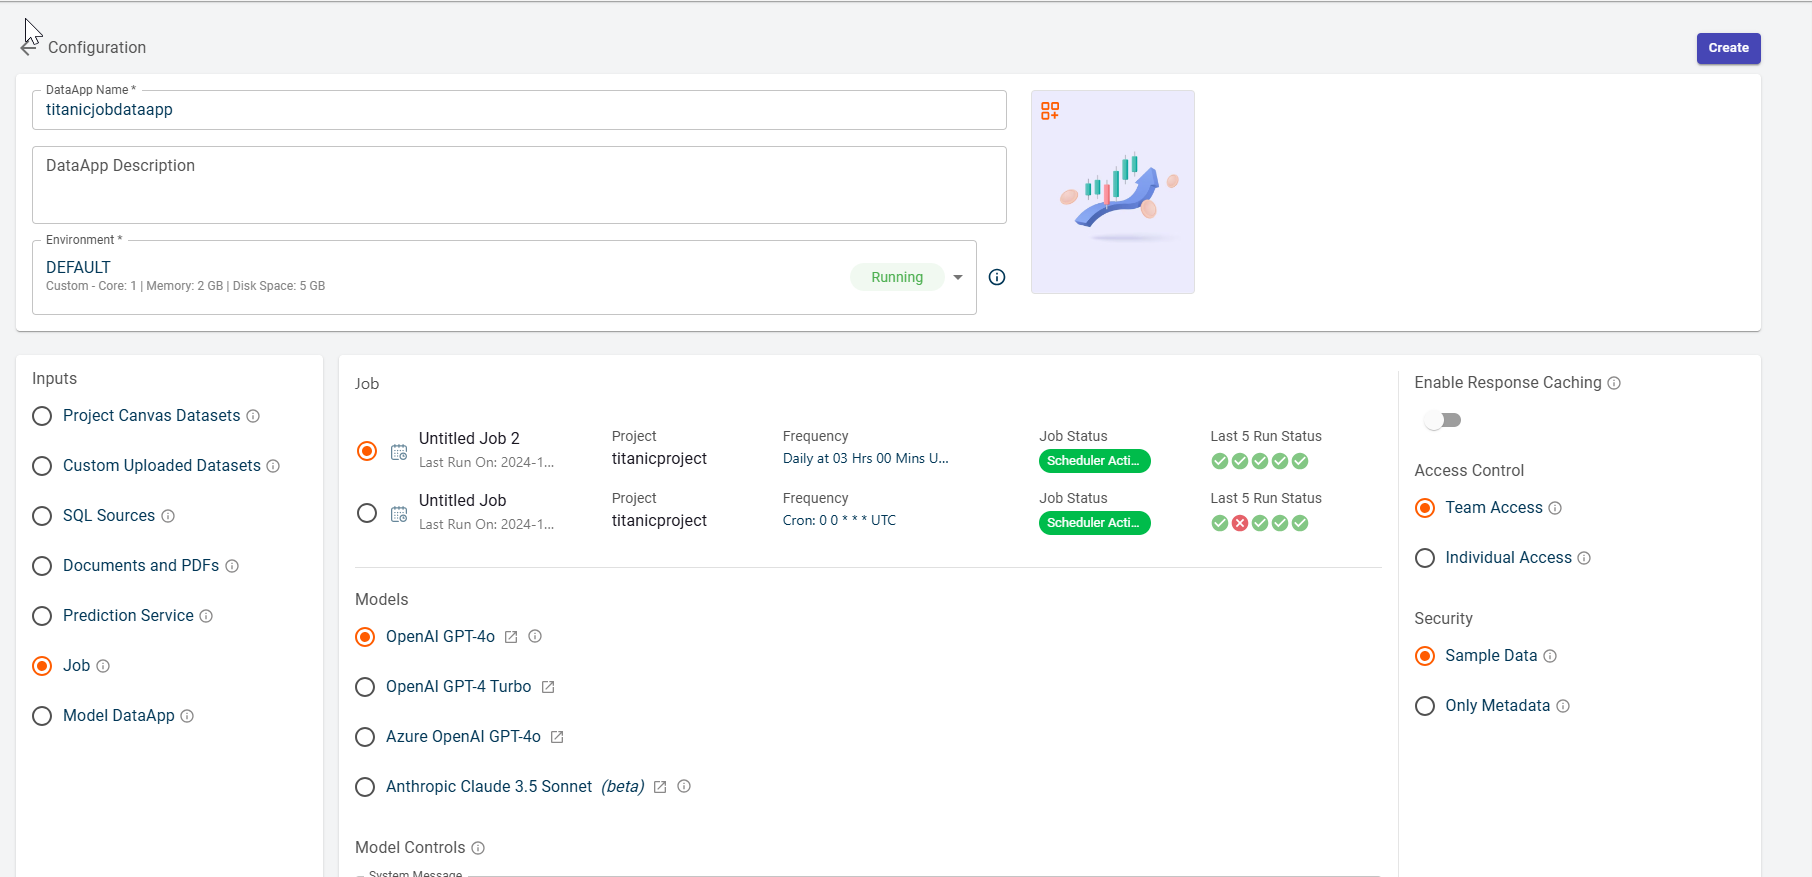
Click the plus icon and select Custom DataApp. This opens the Configuration page.
Select an input as Scheduler. Based on the selected input, the fields change.
Specify this information:
- DataApp Name:
The name of the Dataapp.
- DataApp description:
The description of the Dataapp.
- Environment:
By default, the environment selected during project creation is applied. However, you have the flexibility to choose a different environment for running your DataApps.
Click Choose Image to browse and select the image that is visible on the DataApp cards.
Select a model that you want to use in the Custom DataApp. Possible values:
OpenAI GPT-4o (by default this is selected)
OpenAI GPT-4 Turbo
Azure OpenAI GPT-4o
Anthropic Claude 3.5 Sonnet (beta)
Select the job on which you want to create the DataApp from the list of jobs created in the project.
Toggle ON the Enable Response Caching option to return the same response for the identical queries despite asking multiple times.
Toggle ON the Show Model Response Code option to view the code generated by the model in response to the queries.
Enable Allow Column Hyperlinks to create hyperlinks between columns in related tables.
Select Access Control to manage access to chats and charts generated within the DataApp. The available options are:
Team Access: Allows all users within the tenant to view chats and charts in the DataApp.
Individual Access: Restricts visibility of chats and charts to users who created them. For example, if User A creates Chat A and Chart C, only User A can view these.
Select the Security options. Possible values:
Sample Data : The sample of 5 rows of data is shared with the LLM for context.
Only Metadata: Only the column names in the dataset are shared with the LLM for context.
Enter Model controls in the text box to provide specific context to the AI guide. This helps in aligning the AI-generated responses more closely with the user’s particular use case
Add starter prompts to help users get started with predefined queries. To add prompts, see Adding starter prompts in DataApps
Click Create. The DataApp card is created.
Click on the DataApp card to launch the AskAI DataApp. The AskAI chat window appears.
Click Select Dataset to Start in the prompt box drop-down and select the dataset you want. All the datasets you are viewing in the drop-down are the input and output datasets generated after the latest job run.
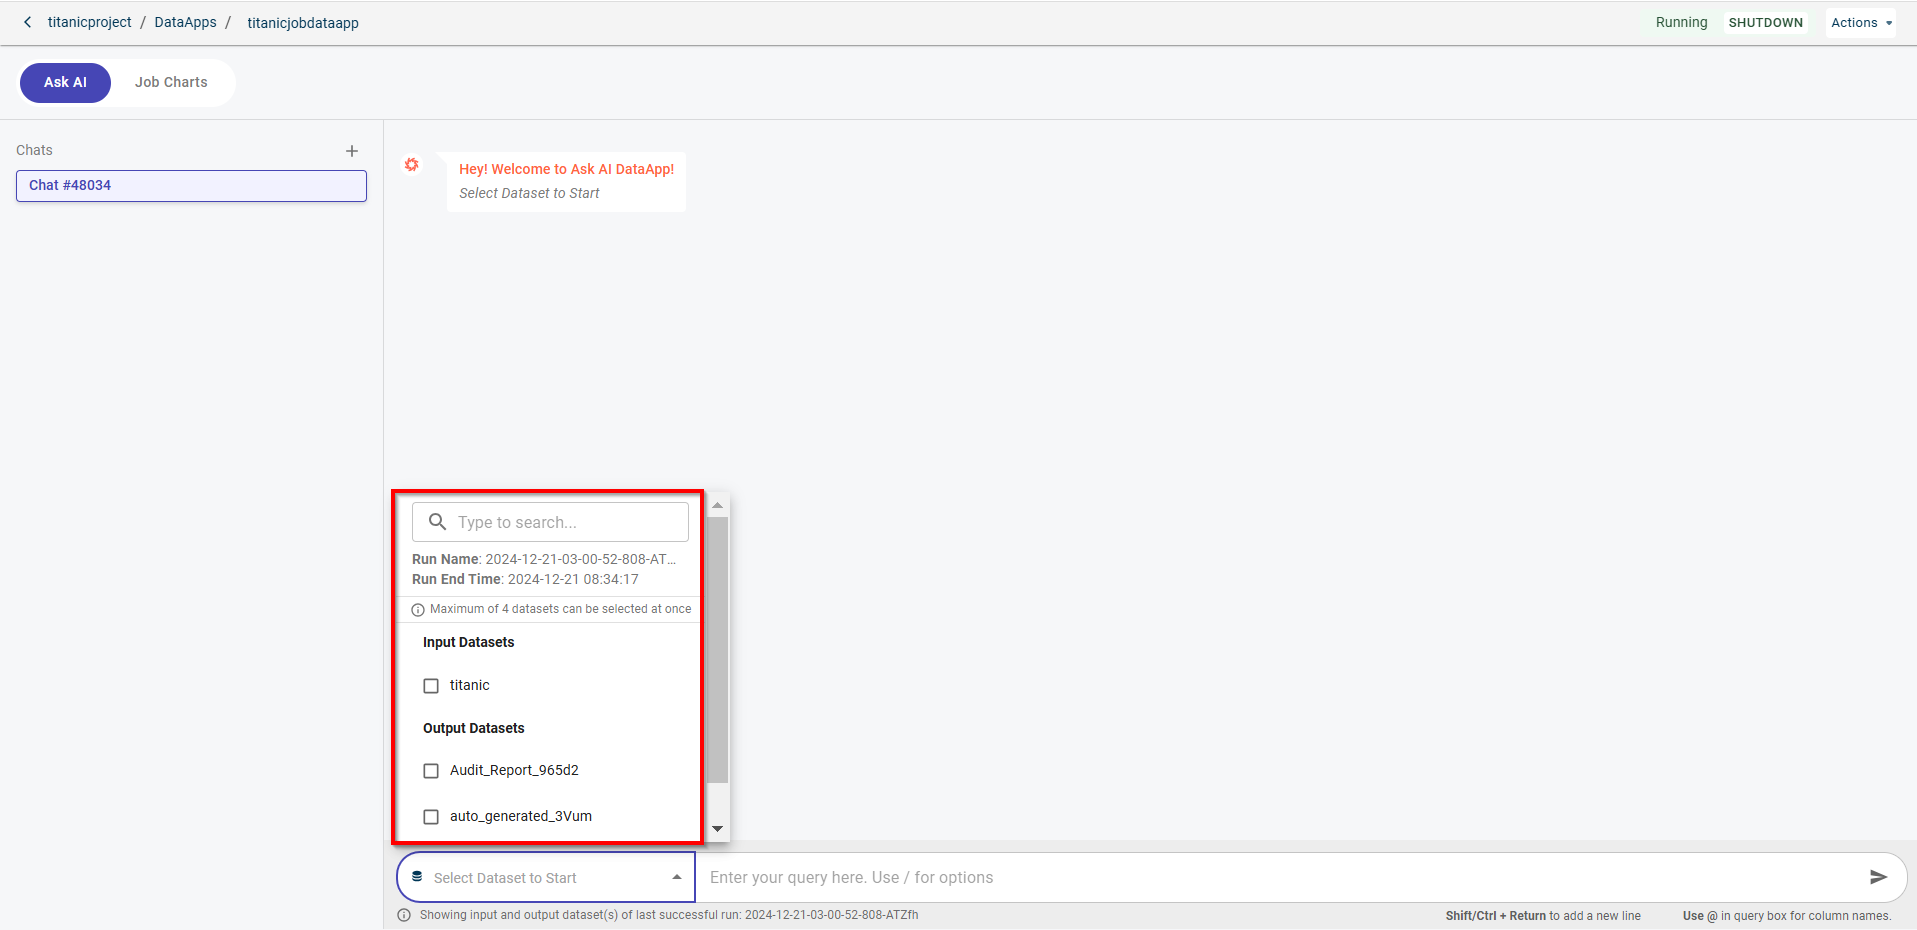
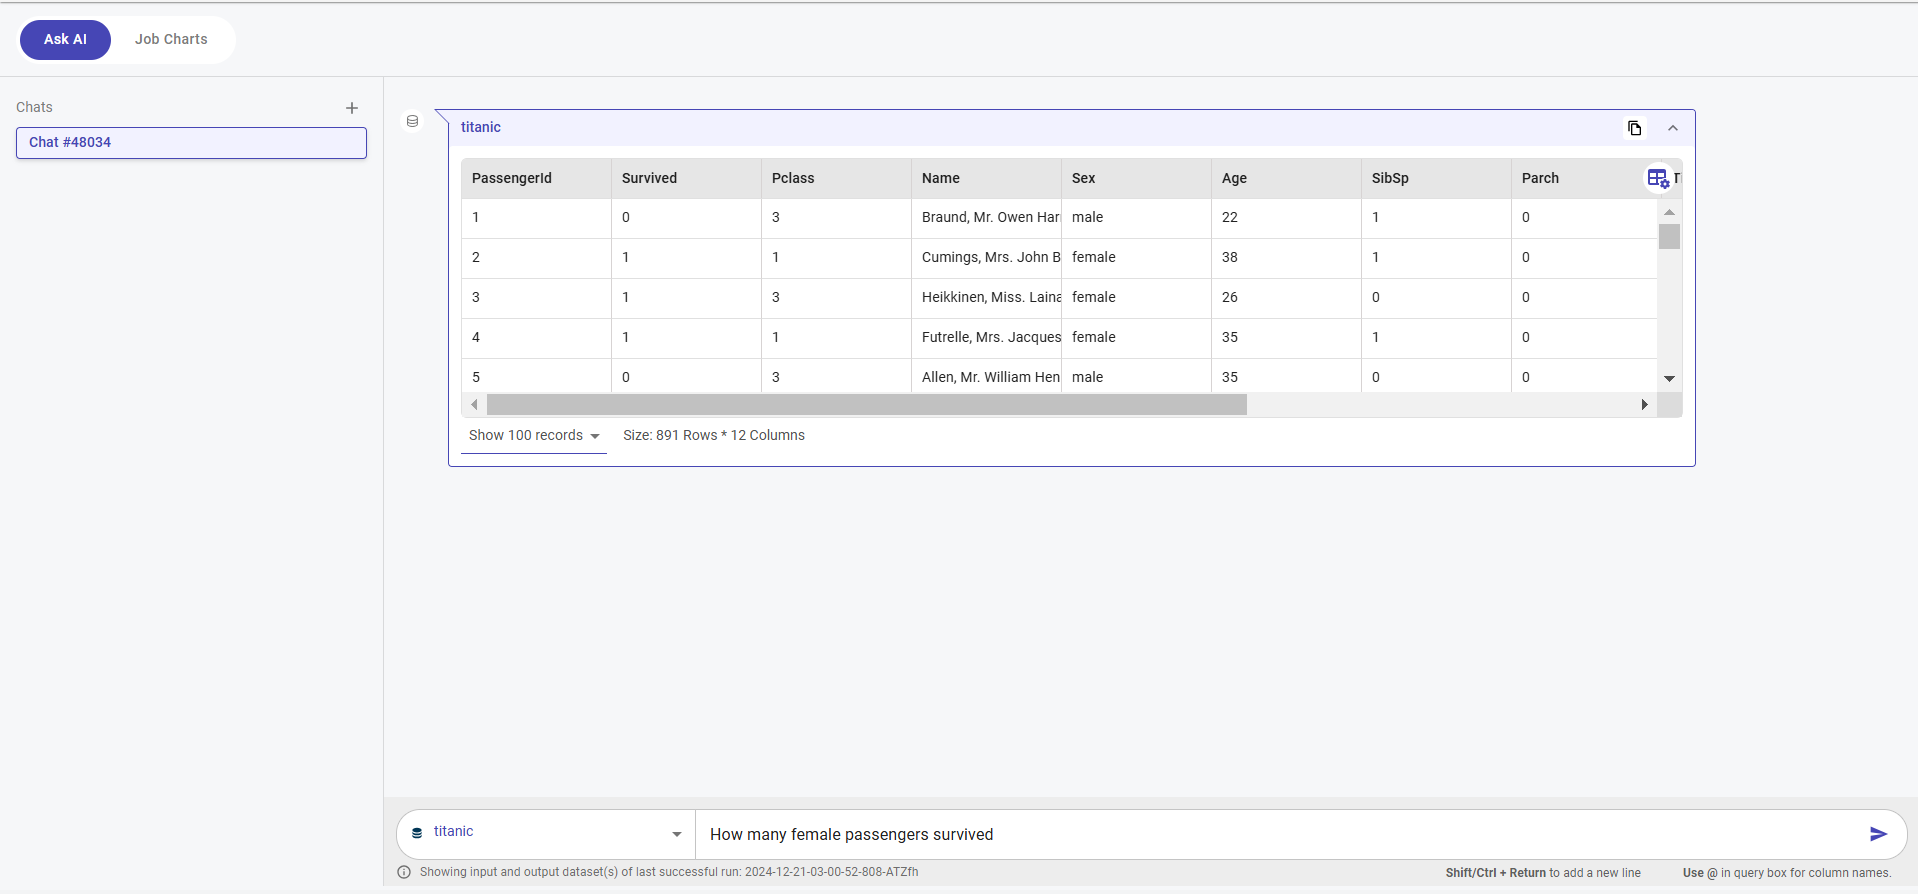
Once you select the dataset, this loads the data onto the chat window.
Enter your query in the query box and use a slash (/) to select the type of output you want the AI to generate, such as text, dataset, or chart.
Once the output is generated, you can:
Copy the answer using the Copy Answer option.
View the generated code by selecting the View Code option.
Get an explanation for each line of code by using the Explain option, which becomes visible only after clicking View Code.
You can also choose from prompt suggestions tailored to the selected dataset.
If you select prompt suggestions, AskAI will provide five relevant prompts. You can either copy a suggestion into the query box or run it directly using the Run button.
If you have an existing AskAI chat created to query input and output datasets or other job-generated outputs, the chat will continue to reference datasets from the previous job run. To query the latest scheduler inputs and outputs, you will need to create a new chat each time.
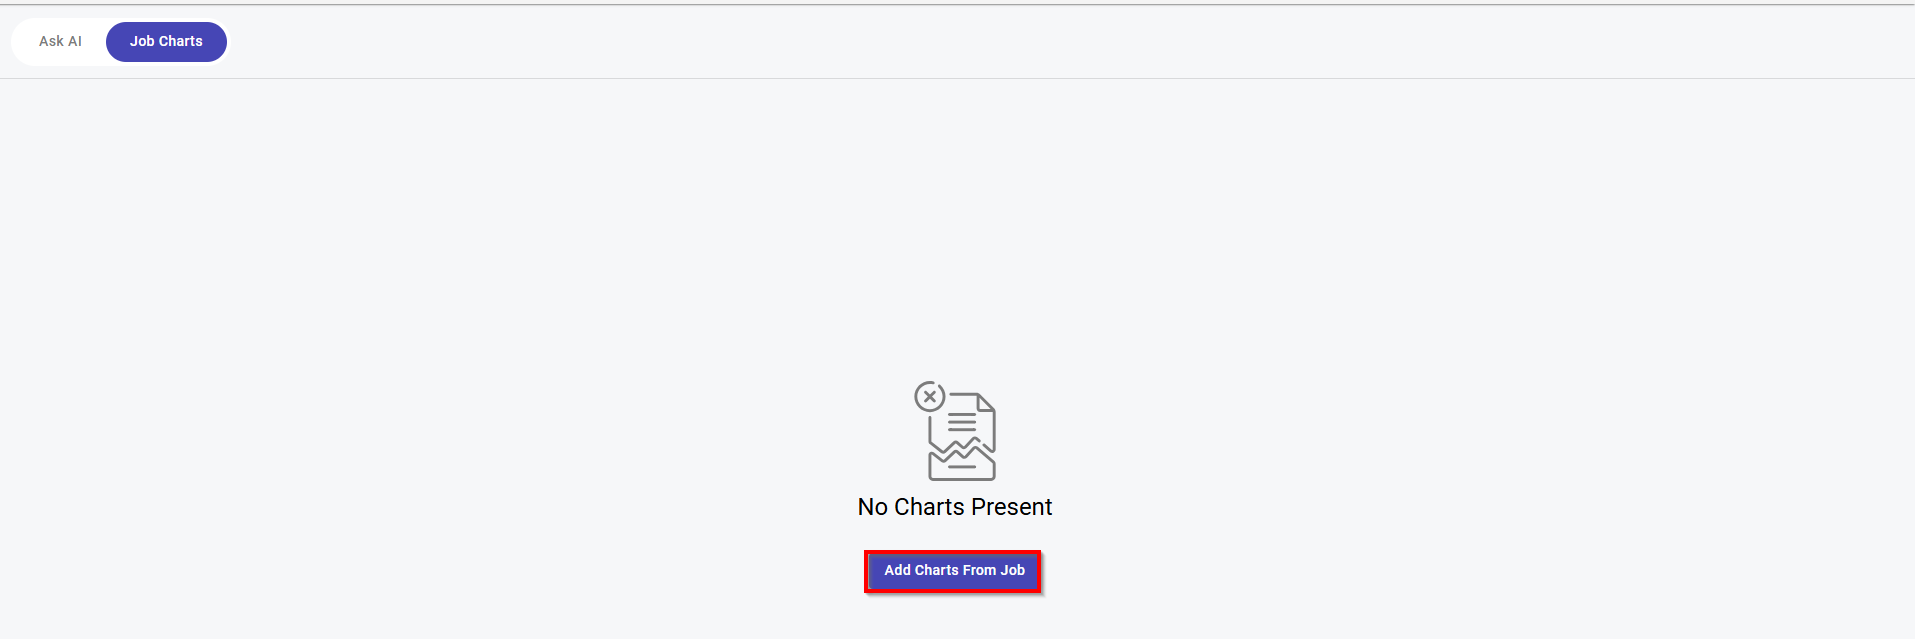
Click the Scheduler Charts tab to add charts generated after the schedule run in this tab.
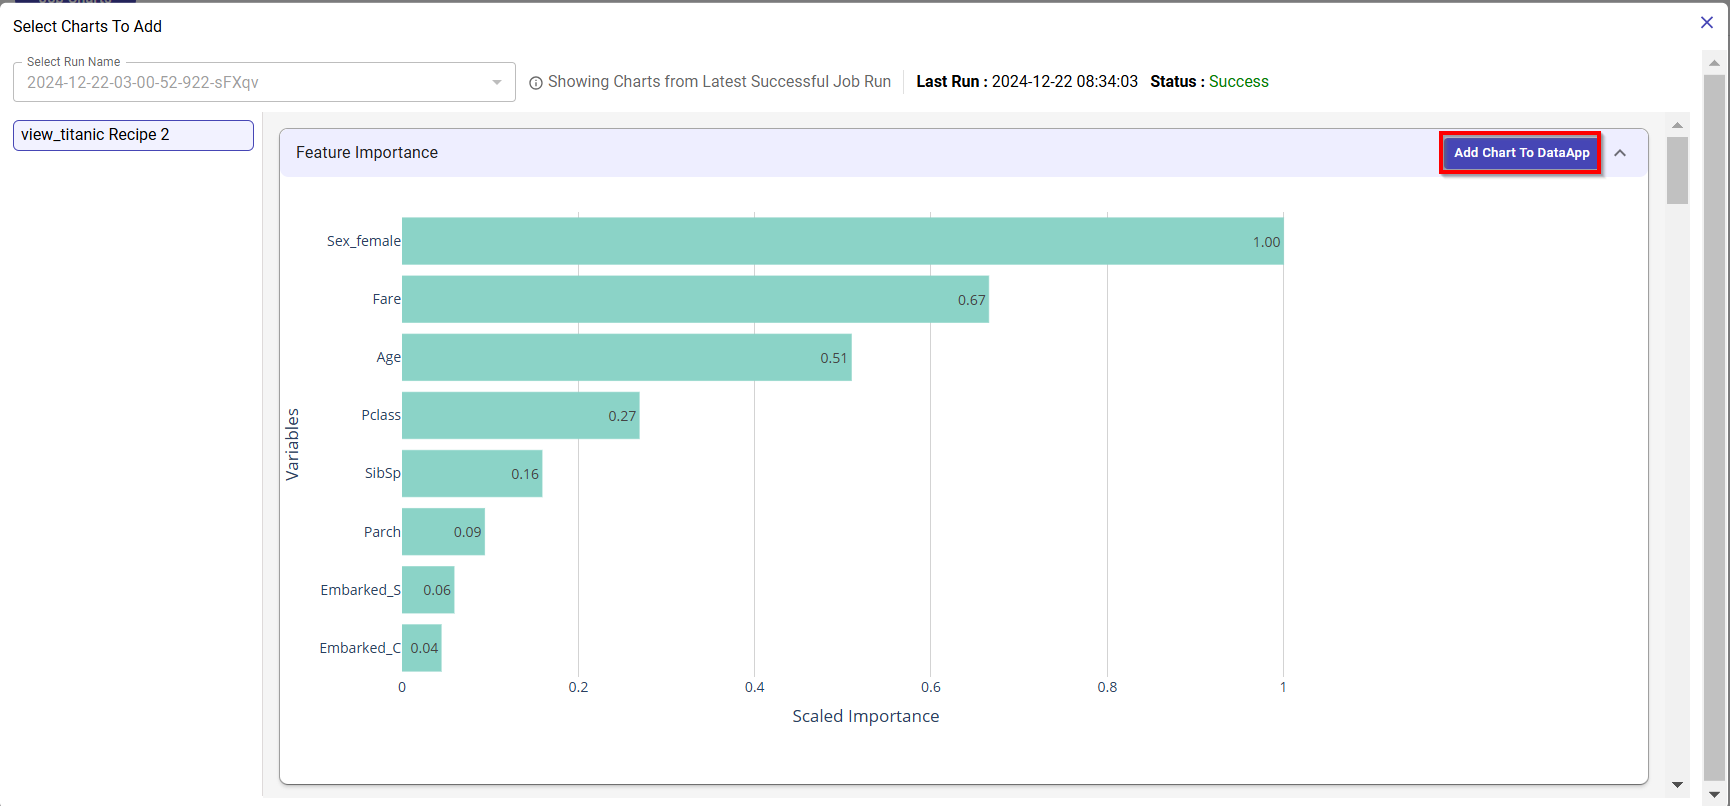
Click Add Charts from Scheduler to add charts. You can choose the charts you want to add to the DataApp if there are multiple charts generated.
Click Add Chart To DataApp next to the chart you want to add. However, if you no longer want this chart in the Job Charts tab, you can use Remove From DataApp to remove it.
Note
Charts are displayed only if the data pipeline generates chart outputs. Furthermore, once a chart output is created after running a query, it cannot be edited like other DataApp input types—for example, modifying the title or changing colors.
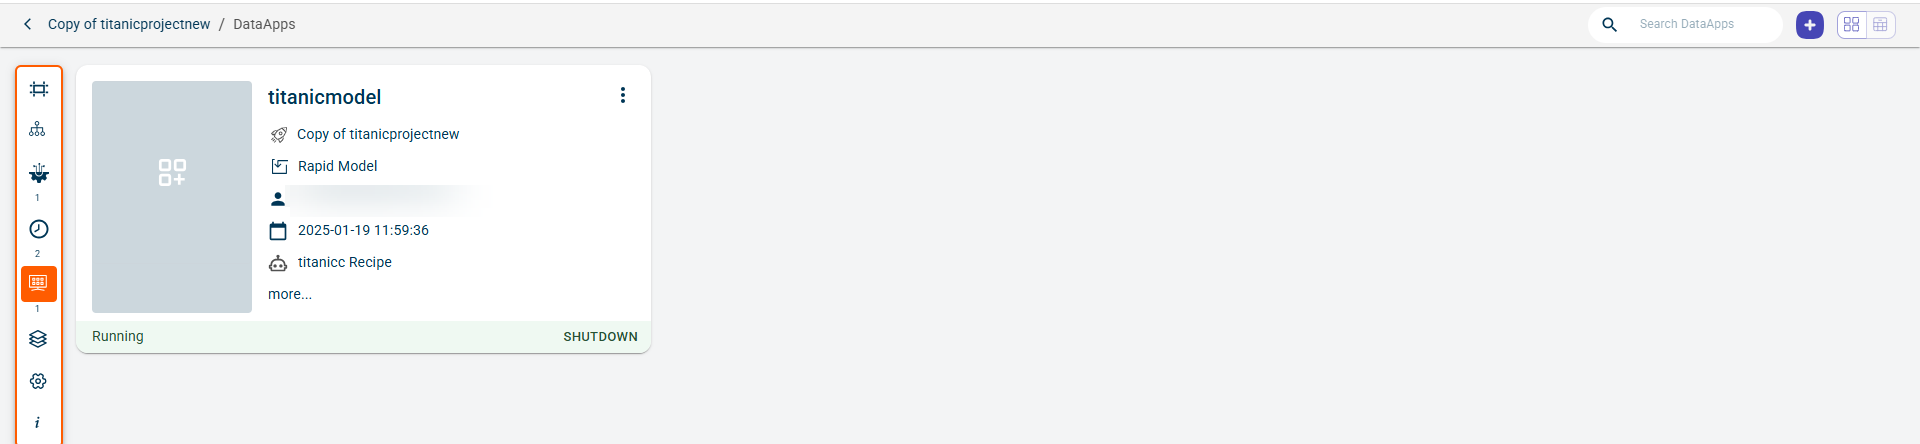
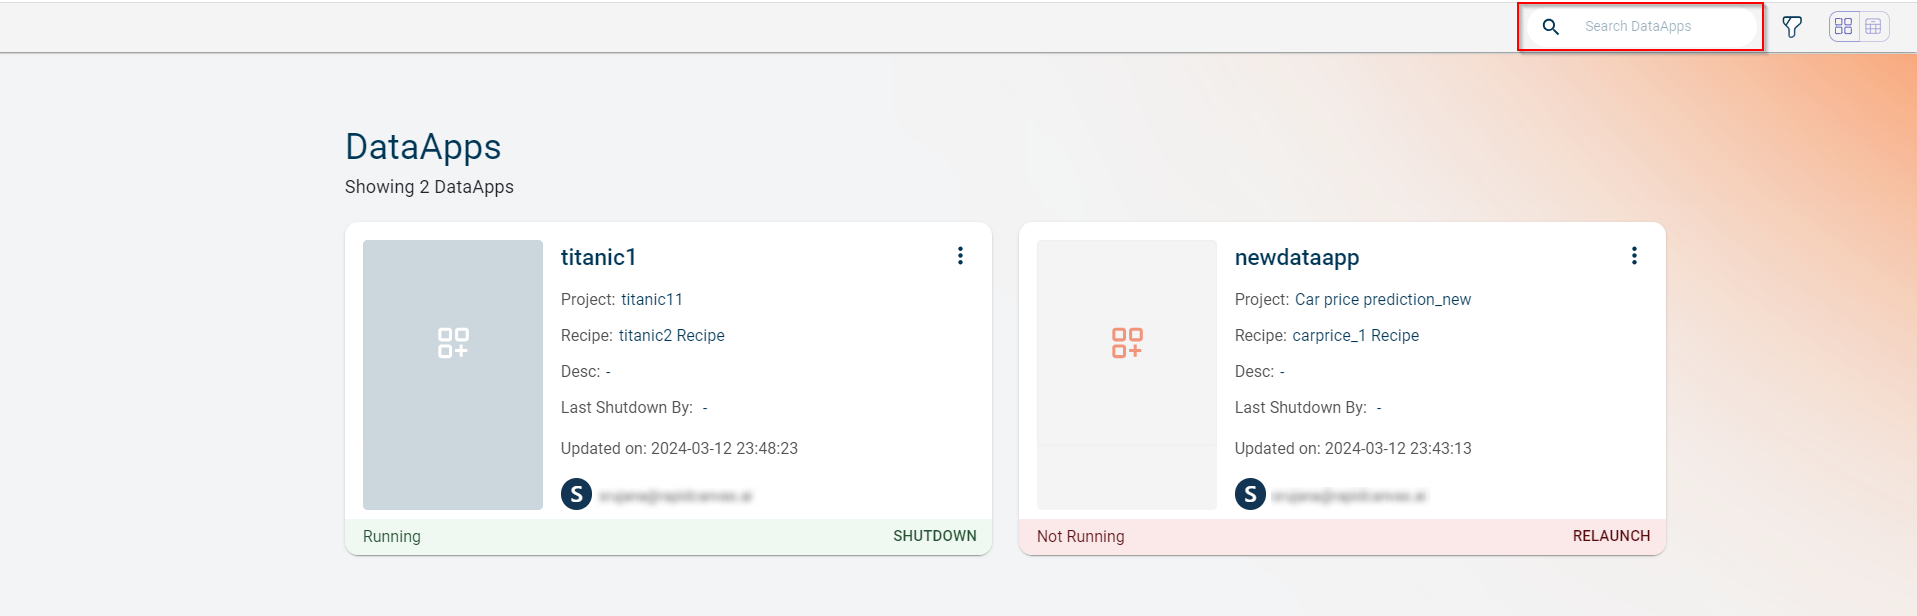
Dataapps dashboard
Dataapps dashboard has all the dataapps in the form of cards. These datapps are either created in projects or published from the Notebook. Each card gives various details such as project name, description of the project, recipe used, the person who created the dataapp, last shutdown by, and the date and time at which the dataapp was created. You can also launch the app and relaunch when the app is idle.
Use the search box to search for Dataapp templates by name.
The list view provides the Data app details in the table form. You can view the same details that you see in the tile view of Dataapps such as DataApp name, Description, Project, Recipe, Input type, Last Shutdown by, Updated by, Updated on and launch status of the app.
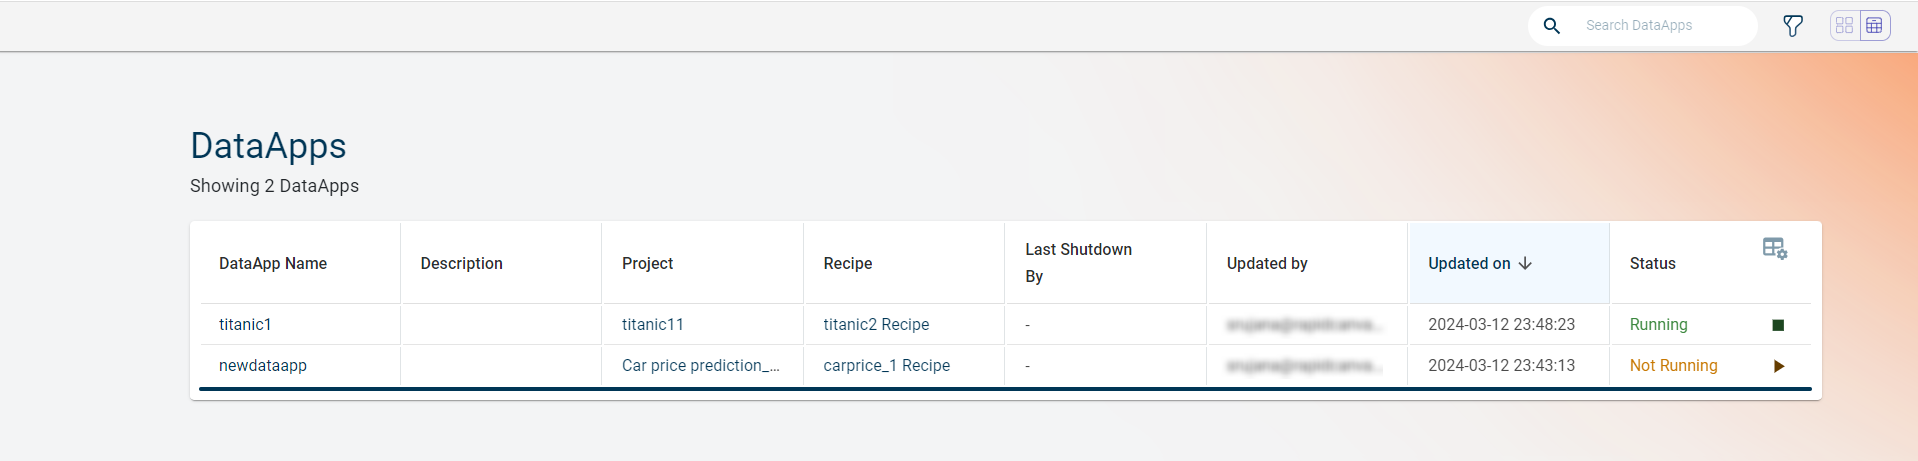
Use the table settings icon to rearrange the columns in the order you want and view or hide the columns by selecting and clearing the check boxes next to the columns.
The card view provides all the data app cards on the dashboard. Click on each card to view the DataApp associated with the project.
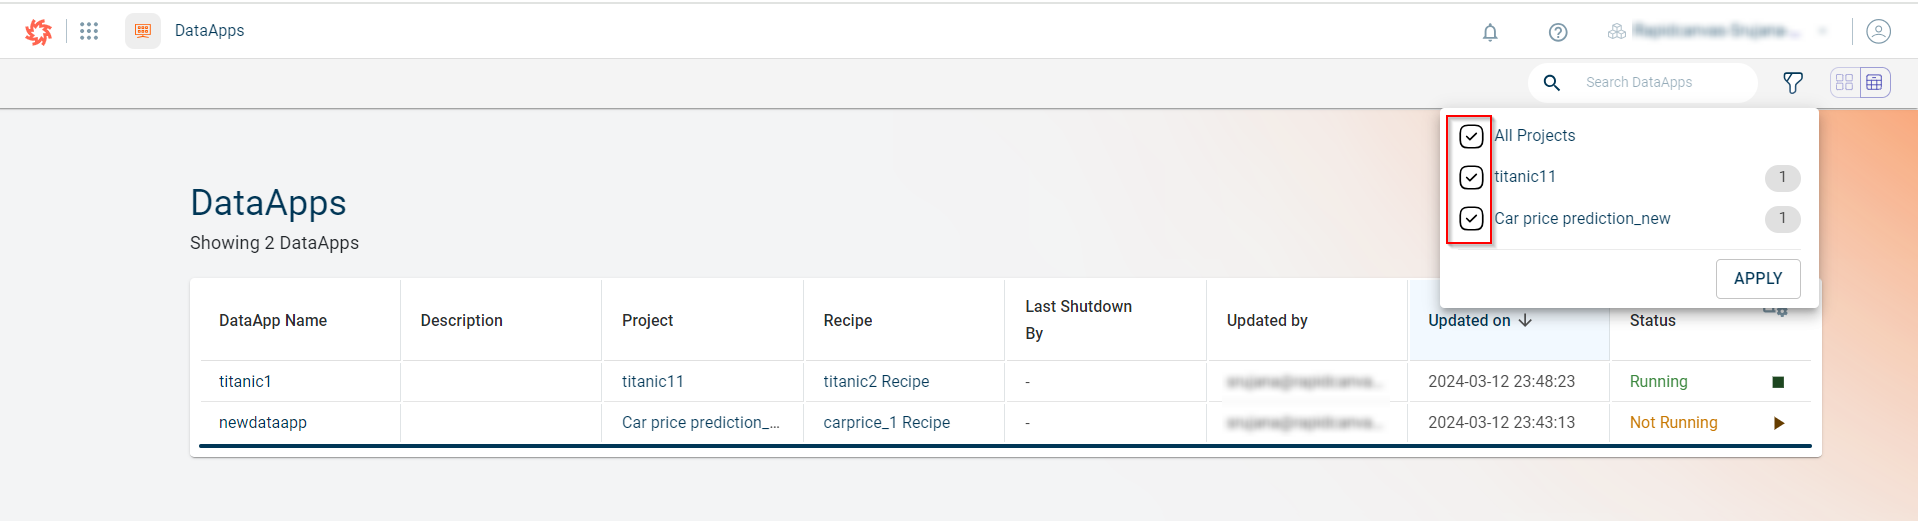
Use the filter option to filer the dataapps by project and view only the dataapps associated with the filtered project on the dataapps dashboard. You cannot view this option in project-level DataApps.
Select or clear the projects whose dataapps you want to view or hide.
Click Apply.
Creating a DataApp
Use this procedure to create a DataApp. Depending on your business requirements, you can create different types of custom or model-based DataApps.
From the Projects Page: DataApps created here are specific to the respective project.
From the DataApps Page: You can create DataApps for any project within the tenant.
To create a DataApp:
Hover over the menu icon and select DataAapps. This shows the DataApps created under this tenant and in different projects.
Click the plus button located in the top-right corner of the page, whether you are in the List View or Card View.
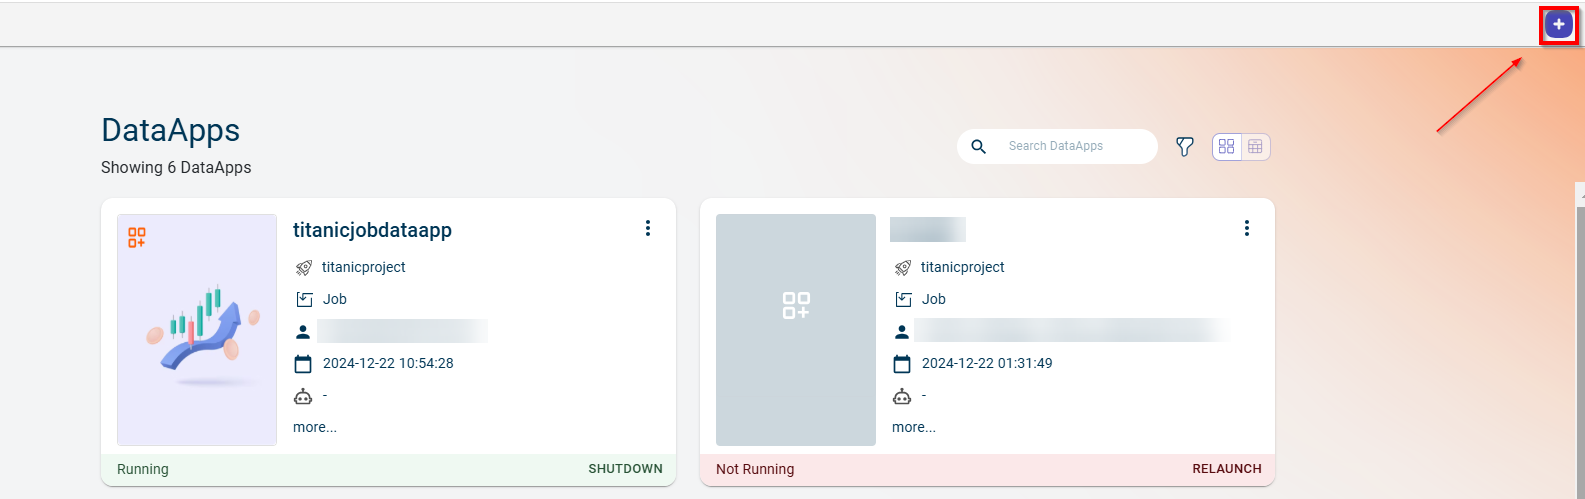
Select one of the following options:
Custom DataApp - Choose this option to create a custom DataApp with your desired input type.
Import DataApp - Use this option to import a DataApp created in frameworks such as Streamlit or ReactJS.
Be it you choose Custom DataApp or Import DataApp, you must select a project in which you want to create the DataApp. This displays the list of projects available within the project.
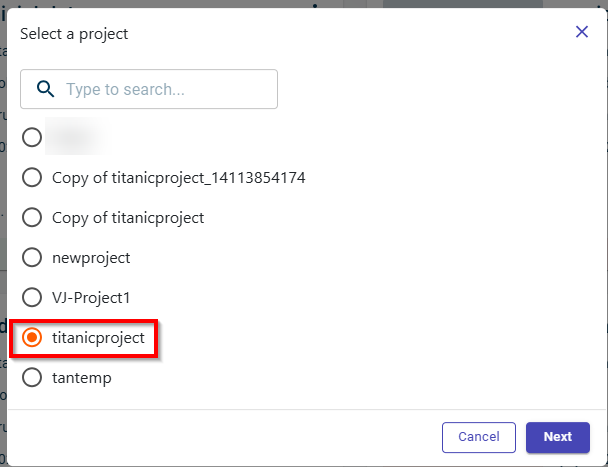
Click Next to proceed to the Create DataApp page, where you can choose the type of DataApp you want to create. The available types include:
Project Canvas Datasets. To create a custom DataApp using project canvas datasets as input, see Creating Custom DataApp using project Canvas datasets as input.
Custom Uploaded Datasets. To create a custom DataApp using custom uploaded datasets as input, see Creating Custom DataApp using Datasets as an input.
SQL Sources. To create a custom DataApp using SQL source as an input, see Creating Custom DataApp using SQL database as an input.
Documents and PDFs. To create a custom DataApp using documents and pdfs as an input, see Creating Custom DataApp using Documents and PDFs as an input.
Prediction Service. To create a custom DataApp using prediction service as an input, see Creating Custom DataApp using Prediction Service as Input Type.
Job. To create a custom DataApp using job as an input, see Creating Custom DataApp using Job as an input.
Model DataApp. To create a custom DataApp using model as an input, see Accessing and Creating a Model DataApp at a project level.
Import DataApp. To import a DataApp to the platform, see Importing DataApps developed through ReactJS or Streamlit.
DataApps developed through ReactJS or Streamlit
If you have DataApps developed using popular frameworks like ReactJS and Streamlit, you can use the Import DataApp functionality to seamlessly integrate them into your project. To ensure a smooth integration, it’s important to select the correct DataApp type during the import process. If the wrong type is chosen, the DataApp may not function as expected.
Once your DataApp is successfully uploaded, the platform will automatically generate the relevant graphs and visualizations to enhance your user experience. Additionally, you can extend the functionality of your DataApp by integrating AskAI capabilities directly into the code. This allows you to query and analyze the data within your DataApp, providing a more interactive and dynamic experience.
This new functionality not only makes it easier to bring in DataApps from external sources, but it also gives you the power of AI-driven queries to unlock deeper insights from your data, creating a more customized and flexible experience.
Follow these steps to import DataApps developed using ReactJS or Streamlit:
Hover over the menu icon and select Projects.
Select the project for which you want to create DataApps and click the DataApps icon from the project-level navigation.
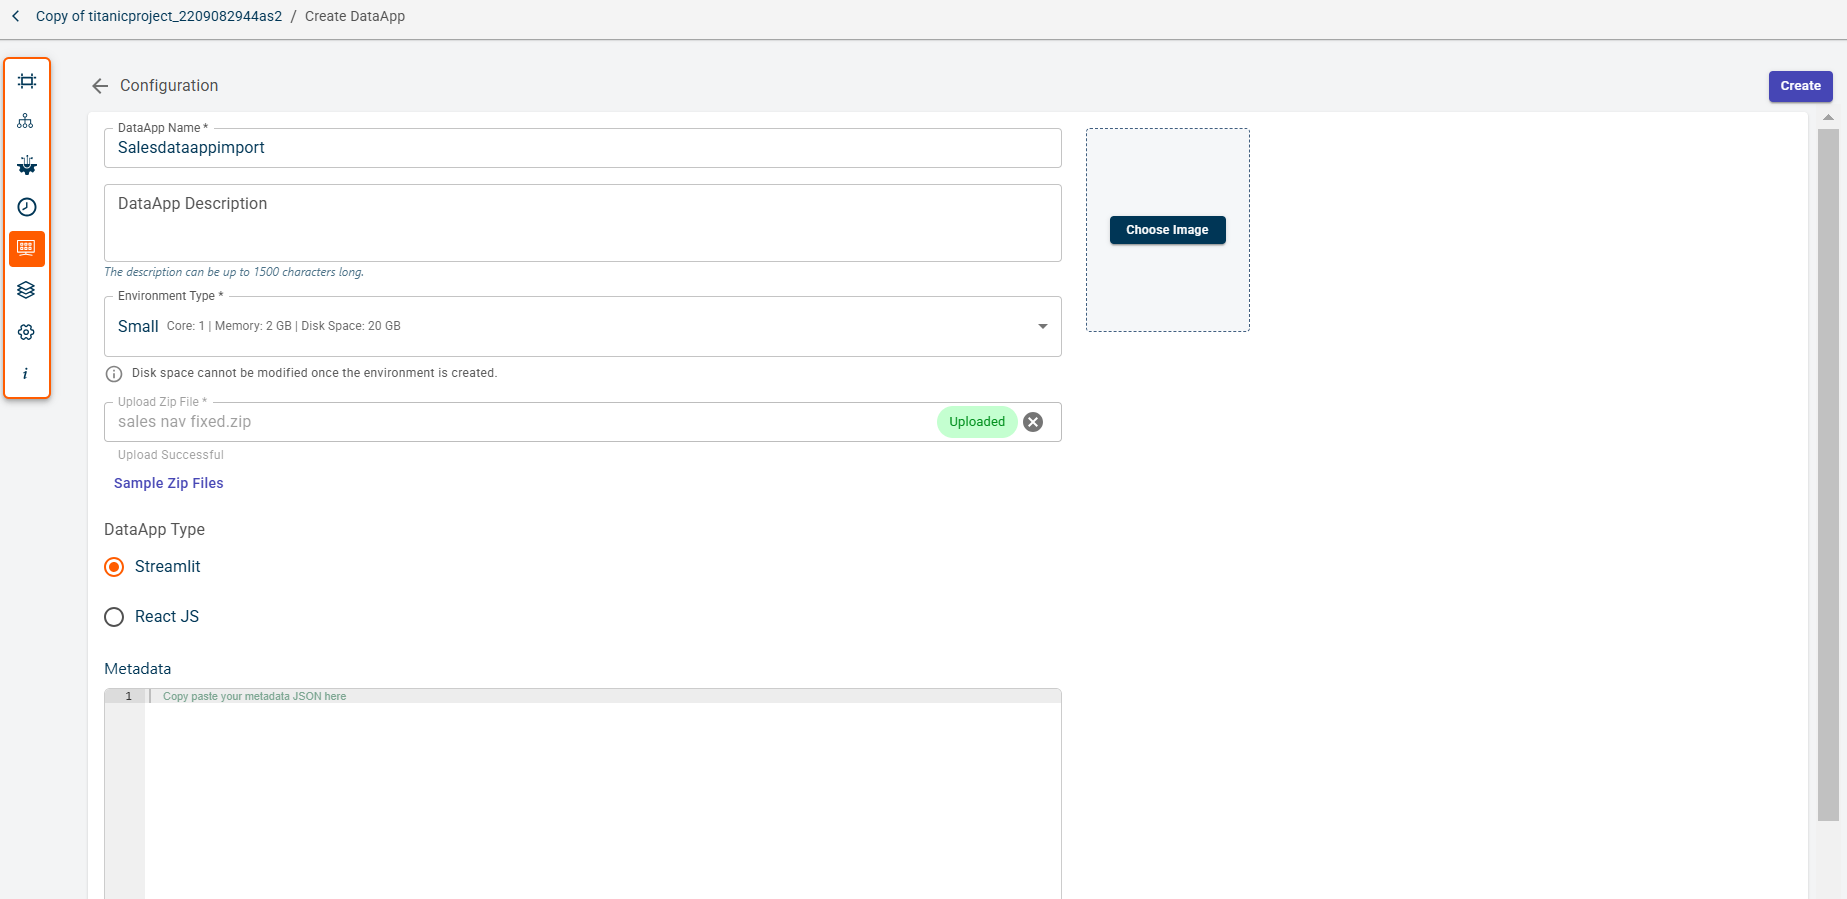
Click the plus icon and select Import DataApp. This opens the Configuration page.
Specify the following information:
- DataApp Name:
Enter the name of the DataApp.
- DataApp Description:
Provide a description for the DataApp.
- Environment:
Choose the desired environment for running the DataApp.
- Choose Image:
Upload an image to display on the DataApp card.
Click Upload and select a ZIP file containing your DataApp code. You can use sample ZIP files to test the import feature or get started quickly.
Select the DataApp Type (Streamlit or ReactJS) based on the framework using which the DataApp has been developed.
7. If the selected DataApp Type is Streamlit, you can view the Python Version field 7. Select the Python version in which the Streamlit DataApp was developed. It supports only two versions of Python - 3.8 and 3.10 7. Add metadata details in JSON format (key-value pairs). 8. Click Create to complete the process. The DataApp will now appear as a card on the DataApps page, where you can open it to view the graphs or interact with the DataApp.
Editing a DataApp
Use this procedure to delete a DataApp.
To edit a DataApp:
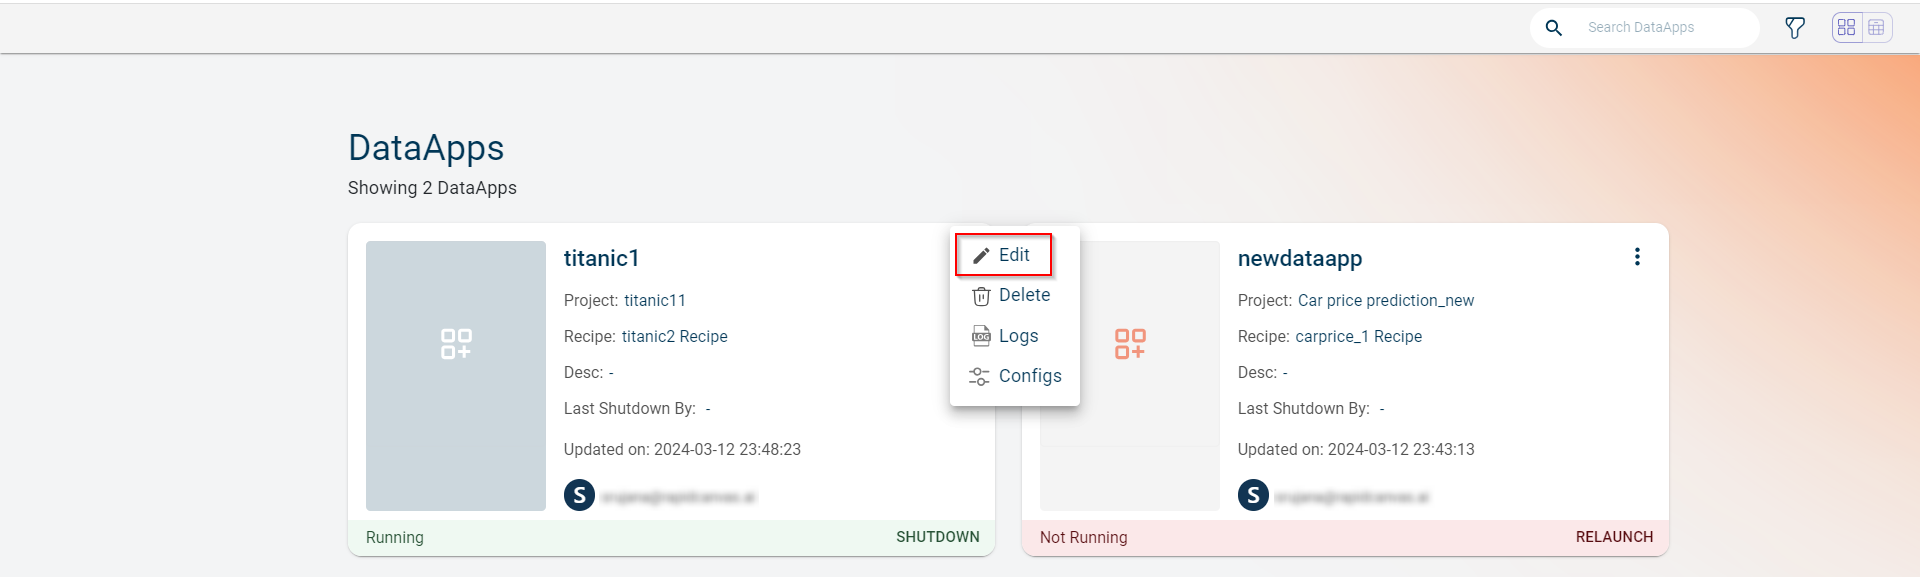
Hover over the menu icon and select DataAapps. This shows the DataApps created under this tenant and in different projects.
Click on the ellipses icon on a DataApp that you want to edit and select the Edit option. This opens the side panel window to make changes to DataApp details.
Modify various details of your DataApp, including the name, description, environment settings, models, security configurations, response caching, and model controls. However, please note that the input type chosen during the creation of the DataApp cannot be edited.
Click Save to update the changes.
Deleting a DataApp
Use this procedure to delete a DataApp.
To delete a DataApp:
From the project left navigation menu, select DataAapps. The DataApps dashboard is displayed.
Click the ellipses icon on the DataApps dashboard.
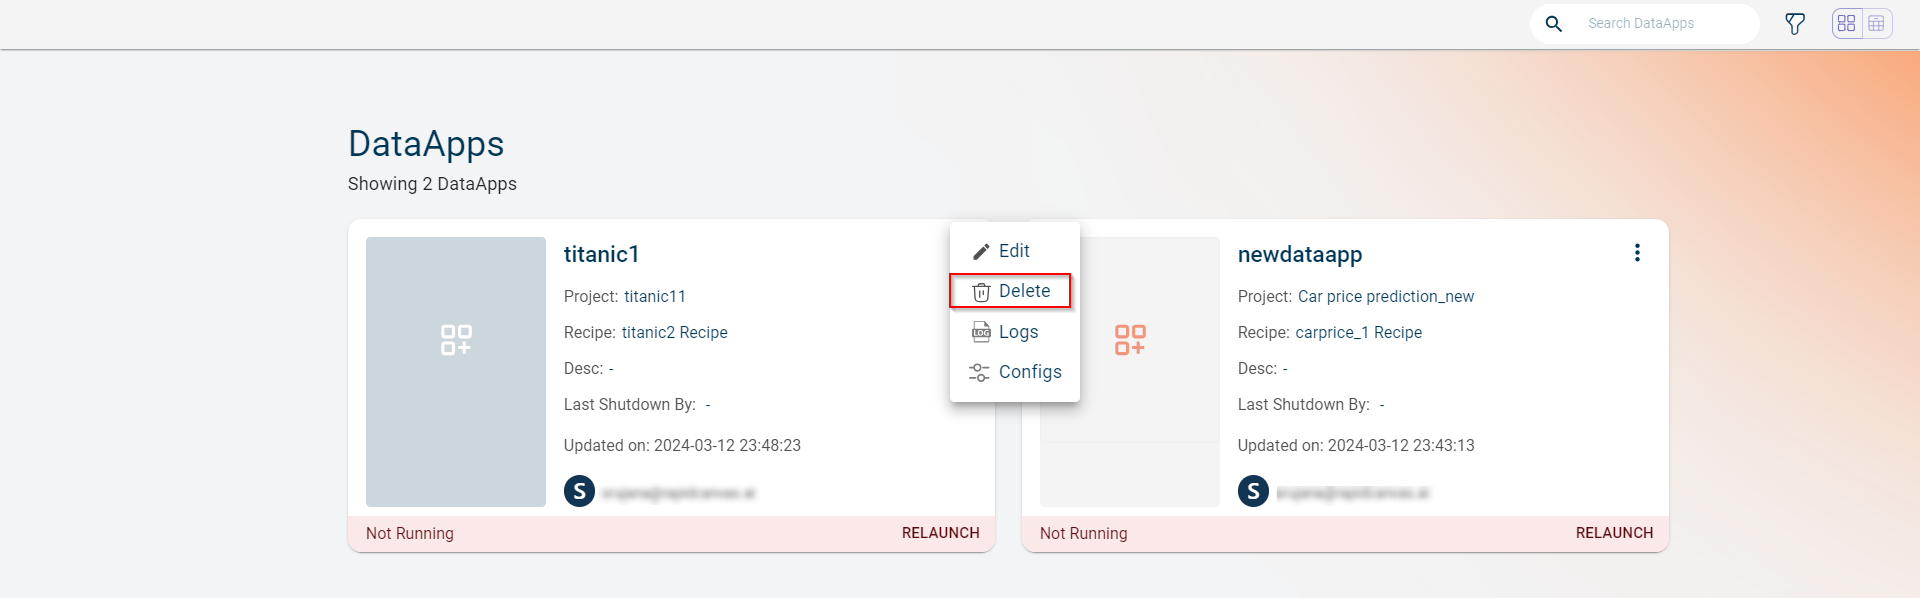
Click Delete. The dialog box appears prompting you to delete or discard
Click Yes, Delete to delete the DataApp permanently.
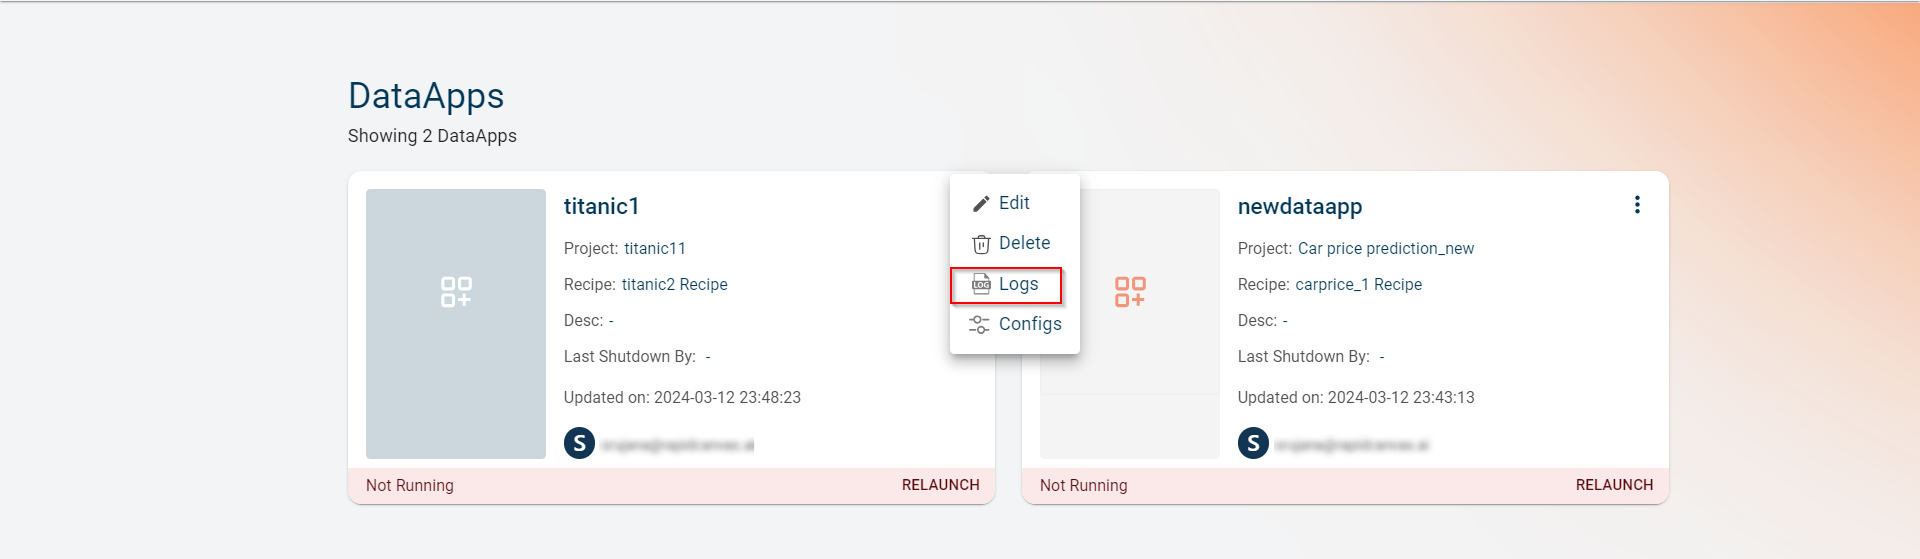
Viewing DataApp logs
Use the history of DataApp logs to debug the issues in DataApp.
To view DataApp logs:
From the left navigation menu, select DataAapps. The DataApps dashboard is displayed.
Click the ellipses icon on the DataApps dashboard.
Click Logs. The logs side panel appears. You can search for the log data you want in the search box.
You can also click on the kebab menu to view two options:
Select Export to export the logs to the text file.
Select Open in New Tab to open the logs in a new tab.
Configuring DataApp Shutdown Time
Use this procedure to configure the shutdown time for DataApp. You can also check resource consumption while DataApp is running.
To view DataApp logs:
From the left navigation menu, select DataAapps. The DataApps dashboard is displayed.
Click the ellipses icon on the DataApps dashboard.
Click Configs.
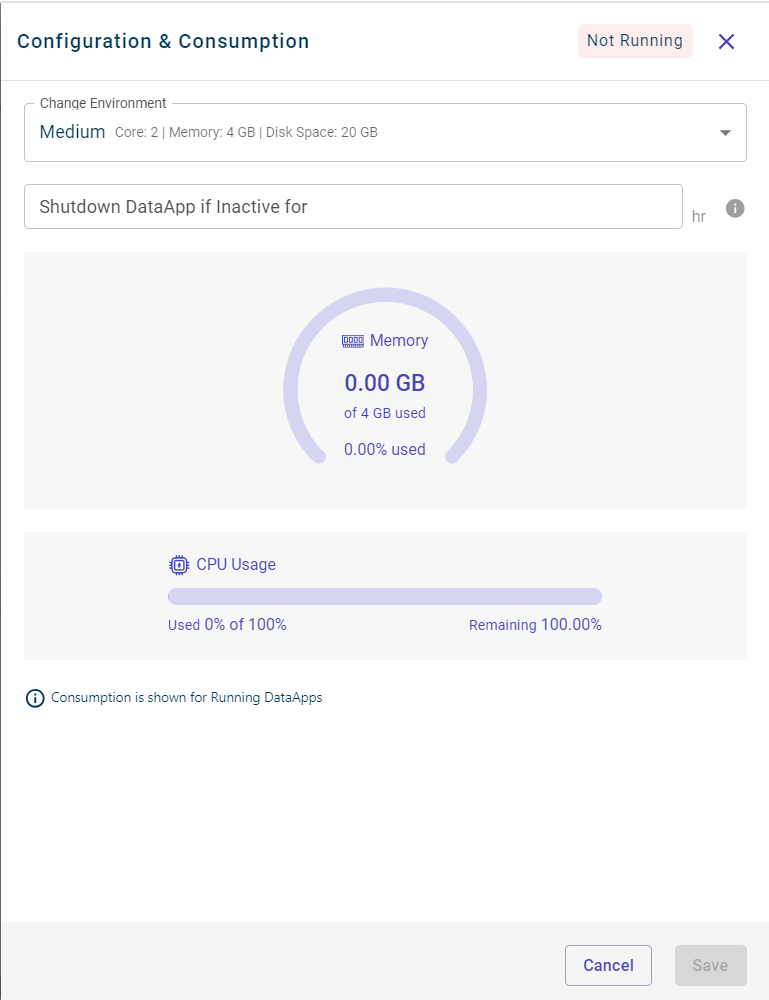
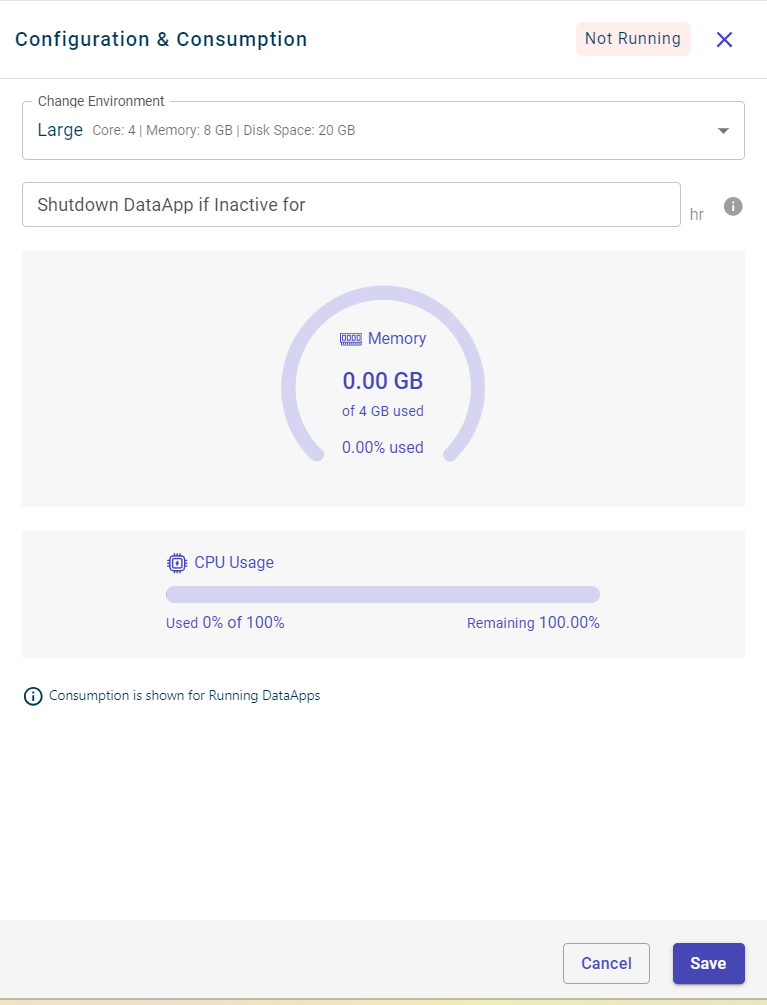
The Configuration & Consumption side-panel appears.
Select the time period (in hours) after which the DataApp should automatically shut down if it remains inactive.
Select Evergreen check box to keep the DataApp Running always.
Clear this check box to specify the time after which the DataApp must shut down if there is no activity. You can set the time in hours.
Click Save.
After generating the chart, you can use the edit option to customize it. This allows you to modify elements such as the chart’s colors, type, and title. Follow the steps below to edit your chart:
Enter a prompt to generate the chart in the AskAI tab of DataApps. You can use the slash option to select the output type, then type your query.
Click the Edit option on the chart to open the Chart Edit window.
Enter the prompt on how you want the chart to be modified. Here, we are entering the query to make the chart colorful and change its title to Number of passengers by Survival status.
You can now see the chart color and title being updated in the screenshot below:
Click Save to save the changes to the chart.
Starter prompts help new DataApp users get started by providing predefined queries on the AskAI page. Users can add up to 10 prompts to guide interactions with AI-powered DataApps, making it easier for business users to formulate relevant queries.
Steps to Add Starter Prompts
From the left navigation menu in Projects, select DataApps to open the DataApps dashboard.
Click the ellipses icon (⋮) on the desired DataApp.
Select Edit to open the Edit DataApp side sheet. Else, you can also add prompts while creating a custom DataApp.
In the Starter Prompts section, enter the prompts you want to display on the AskAI page.
Click +Add Prompt after each entry. You can add up to 10 prompts per DataApp.
Once added, these prompts will appear in the AskAI window, providing users with helpful starting points for their queries.
Note
Starter prompts can be added for all types of custom DataApps, except for model DataApps and imported DataApps