Projects overview
Projects is where the machine learning flows are created. You can develop and run machine learning flows on the project canvas from start to finish. Before you create a flow or data pipeline in a project, you must create a project and select the environment in which you can want to run this data pipeline. The environment has dedicated hardware to run custom projects and is installed with Python packages to run the recipes used in the data pipeline successfully.
The project will have flows and each flow is built with different building blocks such as datasets, recipes, artifacts, models, and charts.
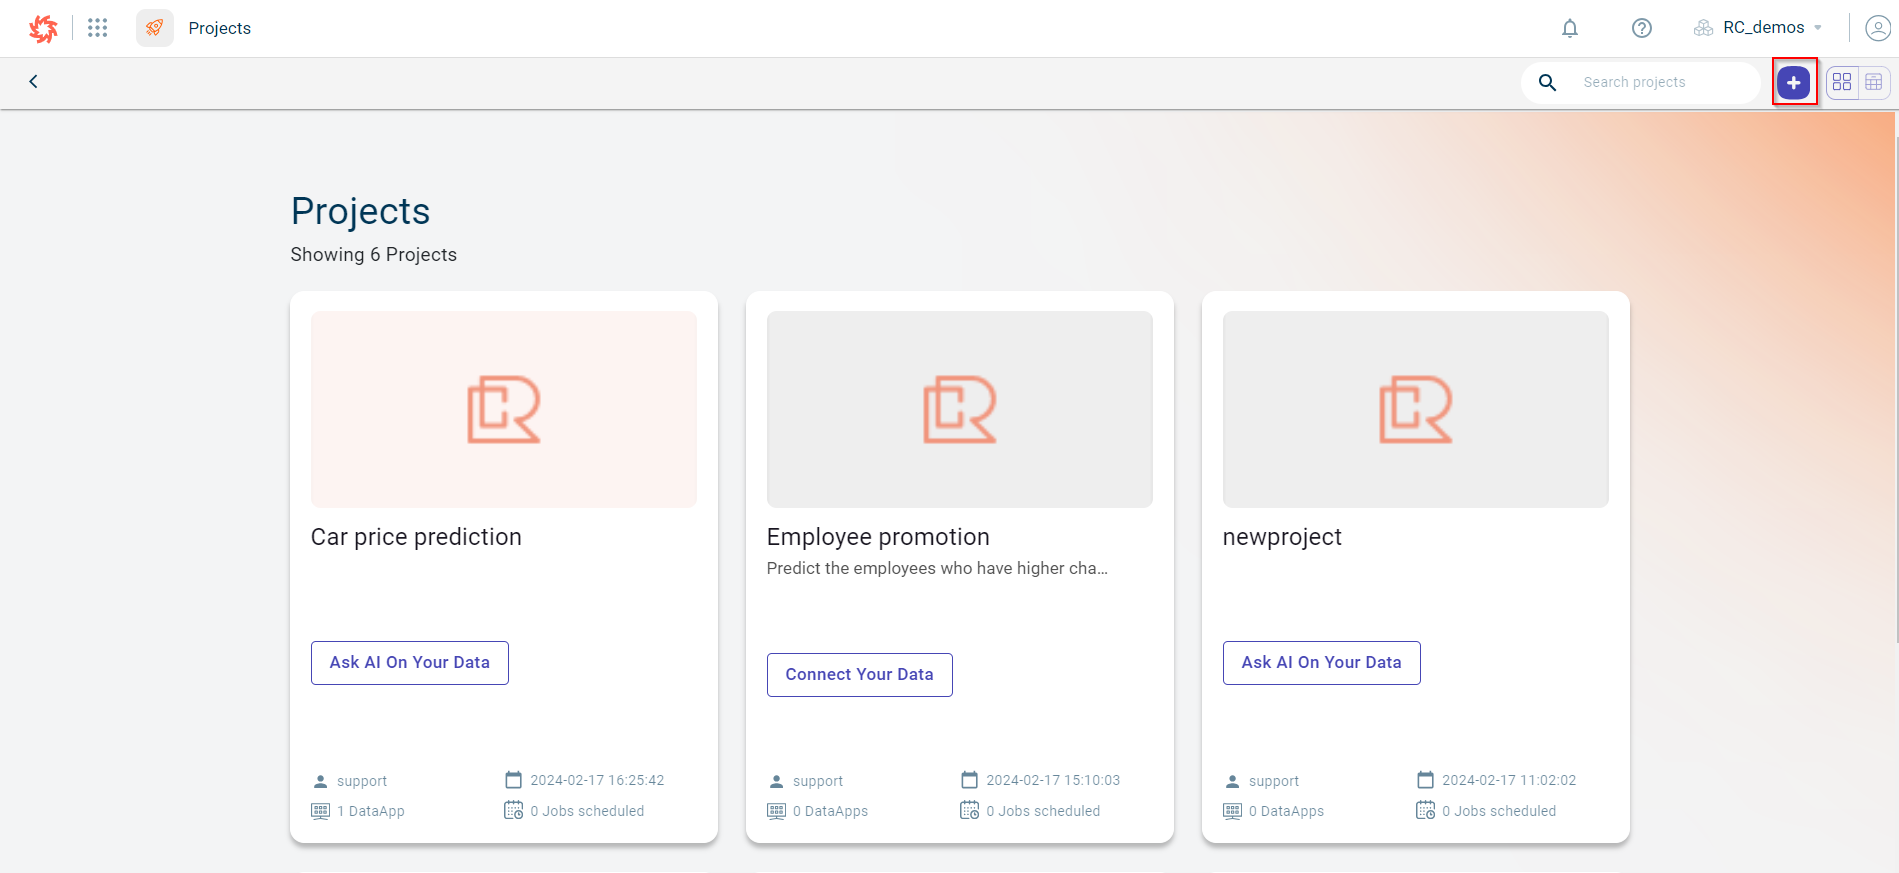
Projects dashboard
The projects dashboard pins all the projects in a tenant in the form of widgets from where you can have quick access to the project you want. On each project widget or card, you can view the total DataApps created and jobs scheduled. The other details you can view are the user who last modified the project, and date and time at which modifications are made.
Various sections on the Projects dashboard
This section explains various sections on the Projects dashboard page:
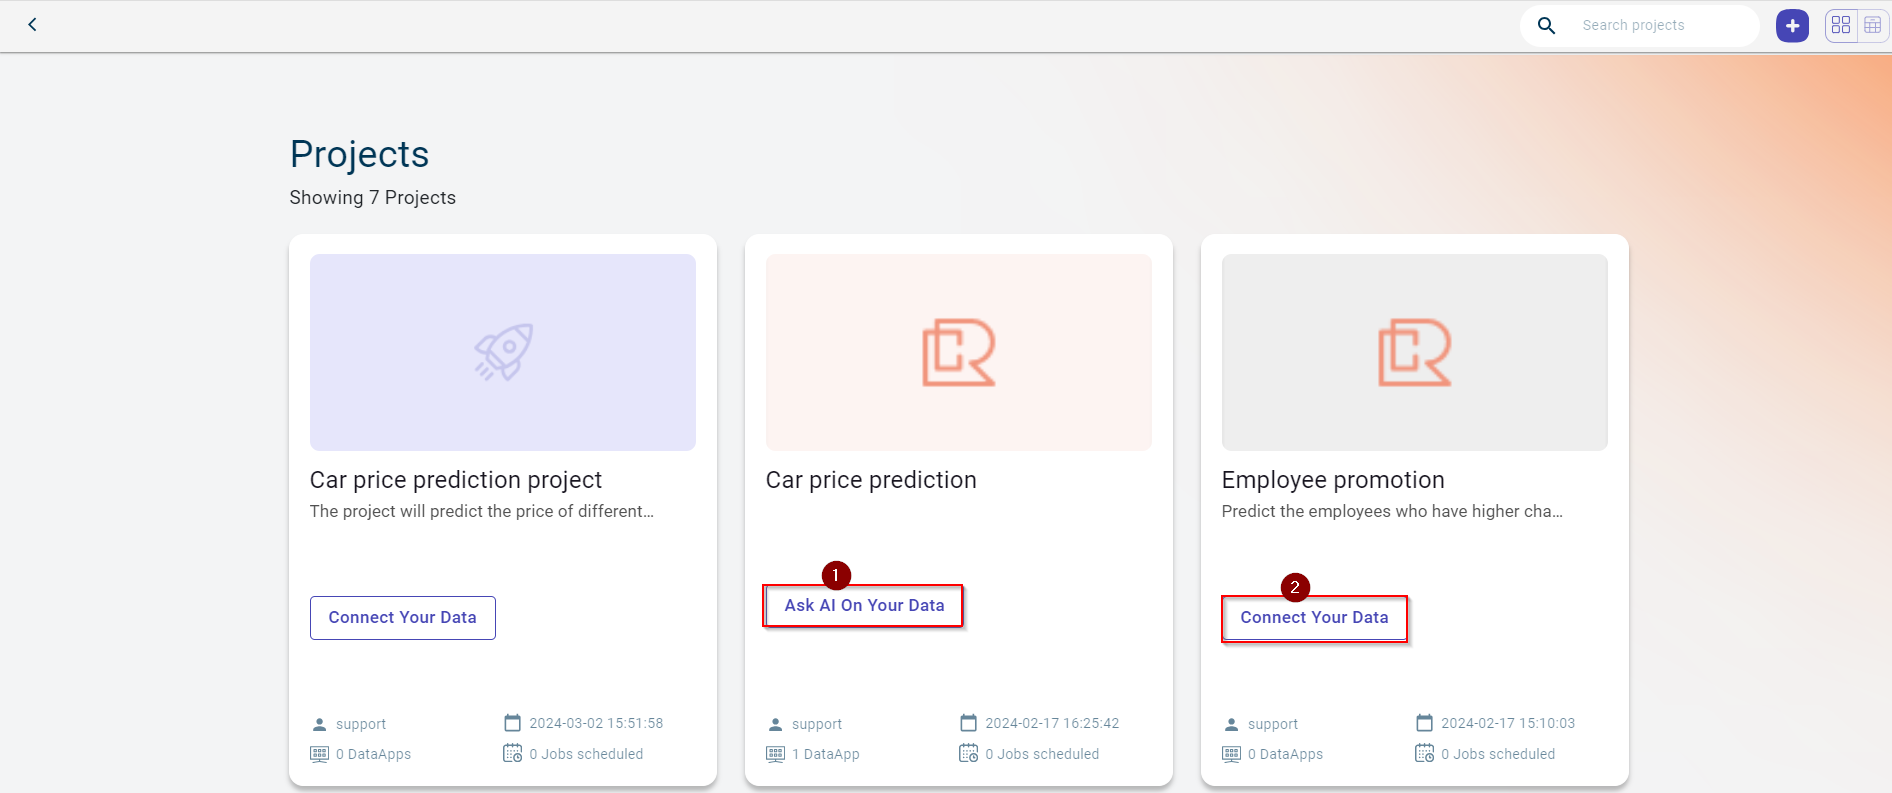
Project card : You can view the user who created the project, number of DataApps created for this project, total jobs scheduled for the project and the last updated time stamp.
You can view two options on the card:
Ask AI On Your Data: Clicking this button takes you to the Ask AI page (AI-Assisted recipe page) to provide the text prompt and generate the recipe.
Connect Your Data: Clicking this button takes you to the window where you can upload the dataset. You can only view this button if the project has no dataset uploaded.
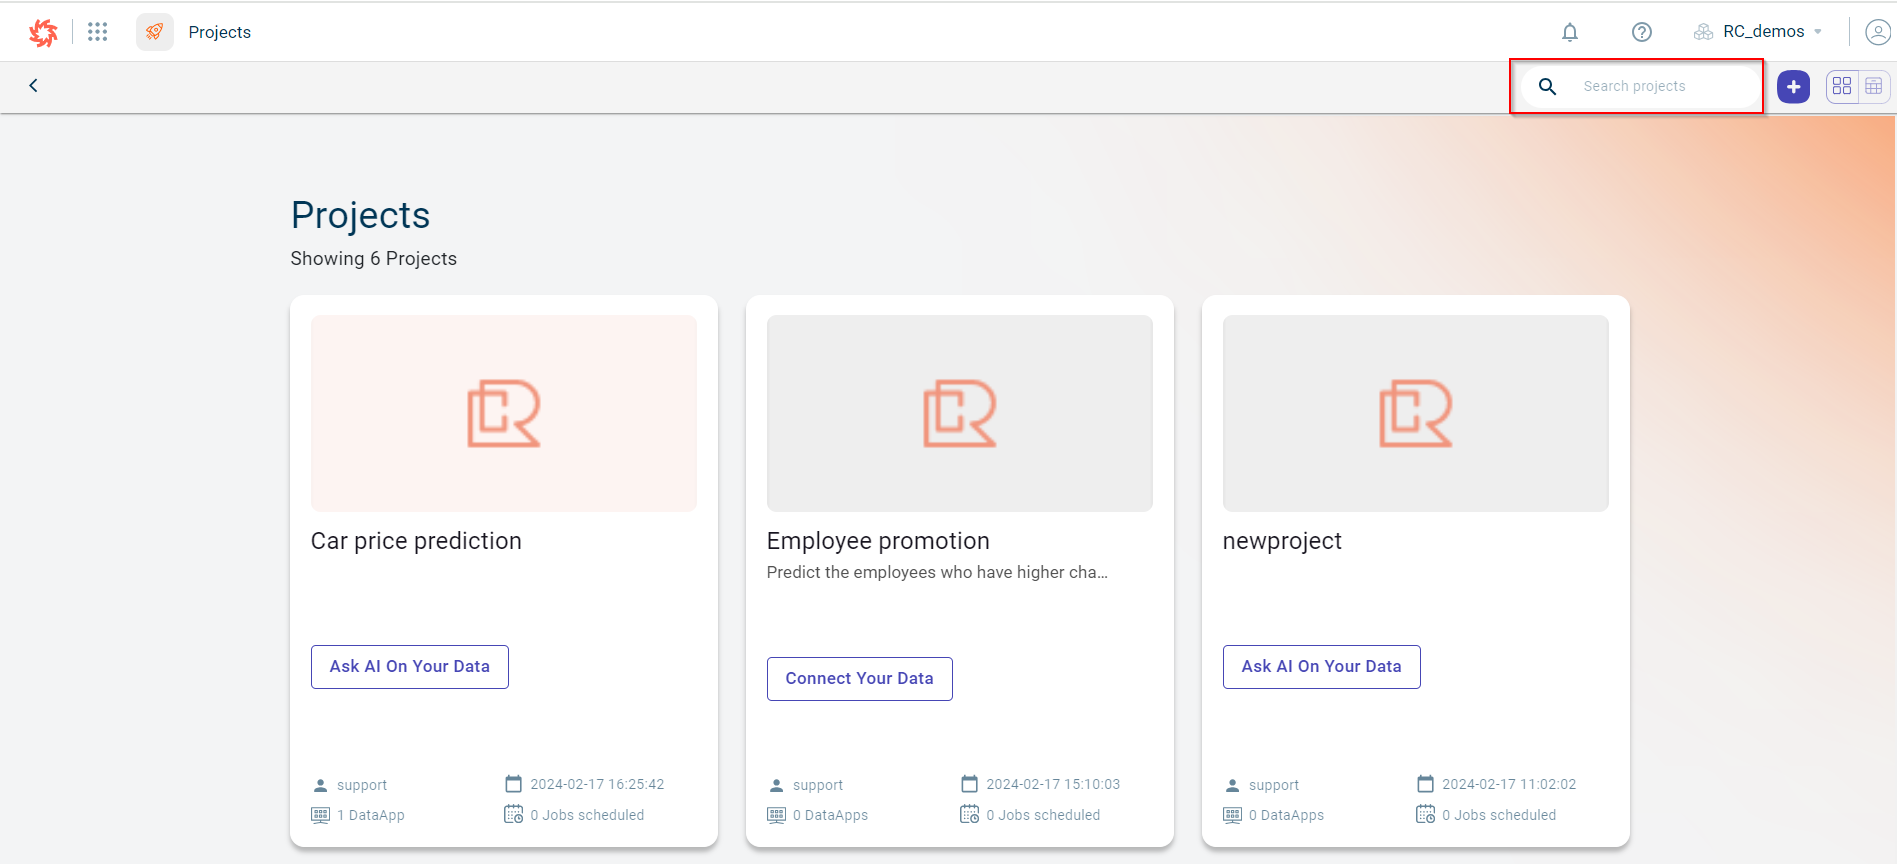
Search: You can search for a specific project by providing the name in the search box.
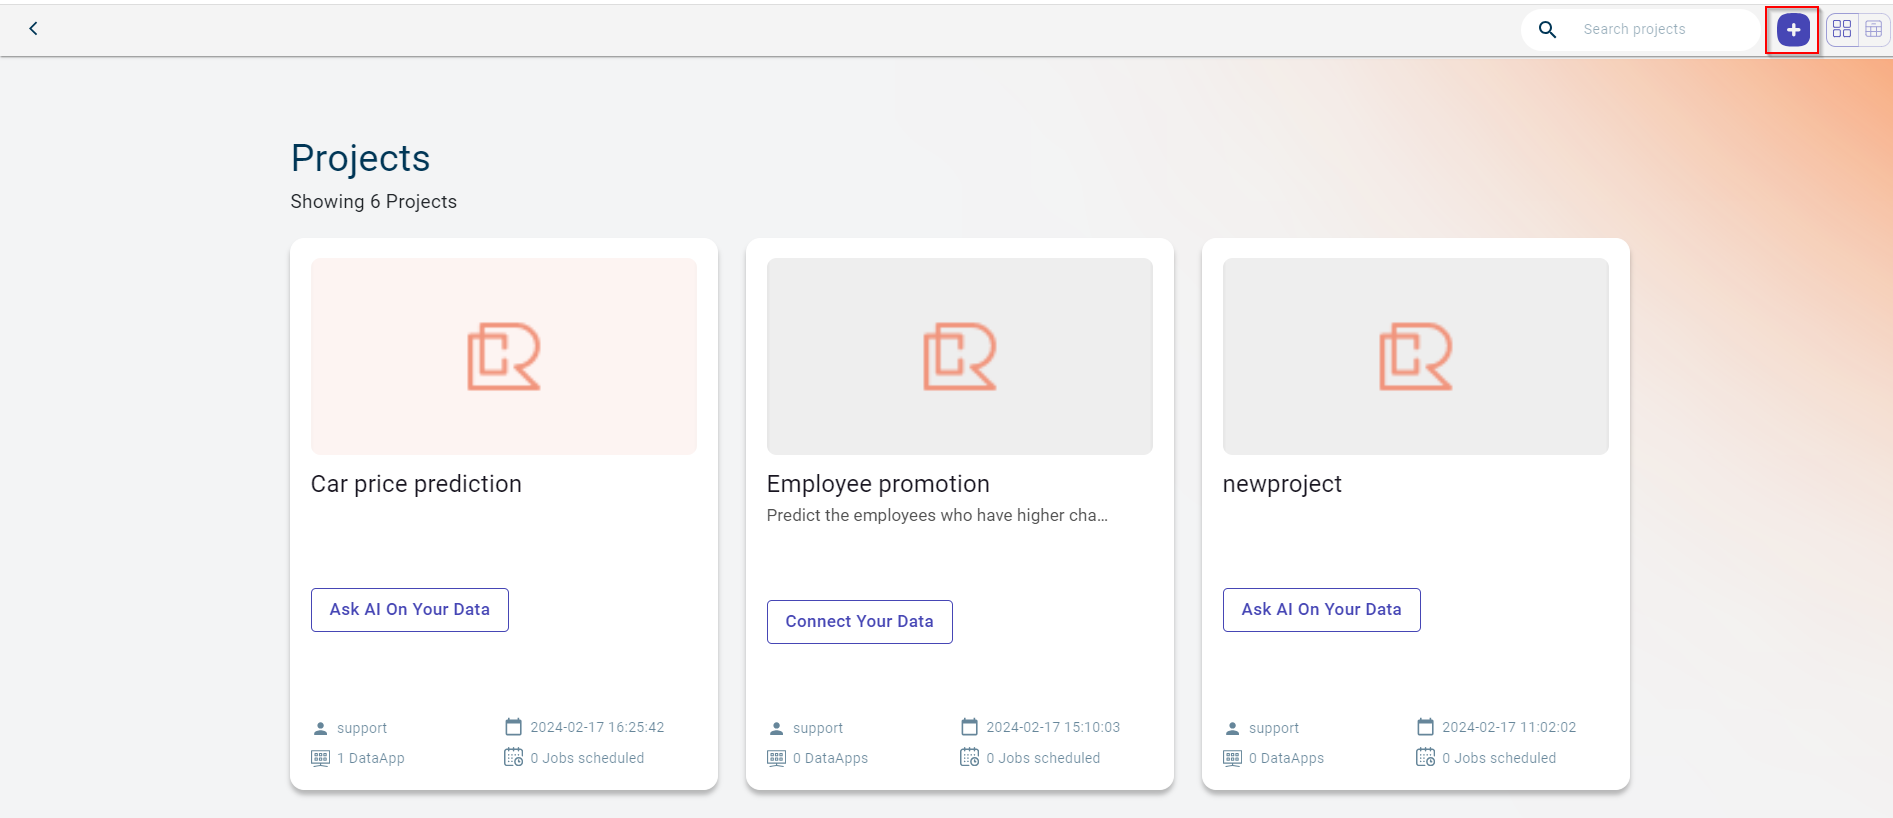
+ Project: You can create a new project. For more information, see Creating a new project.
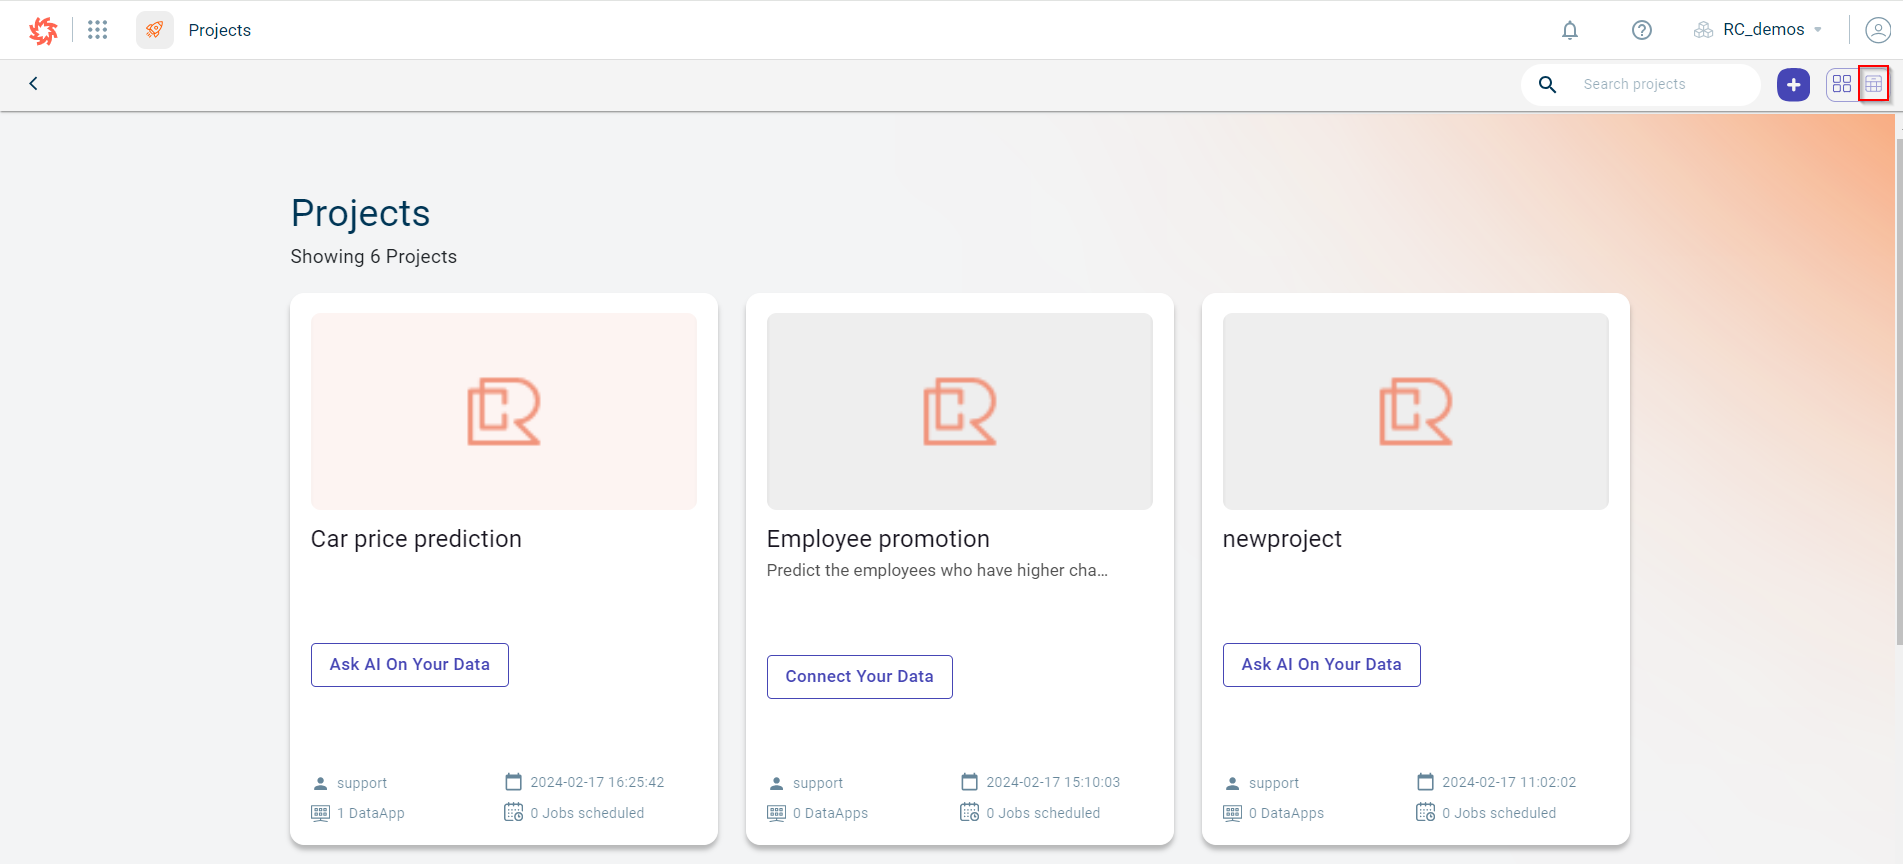
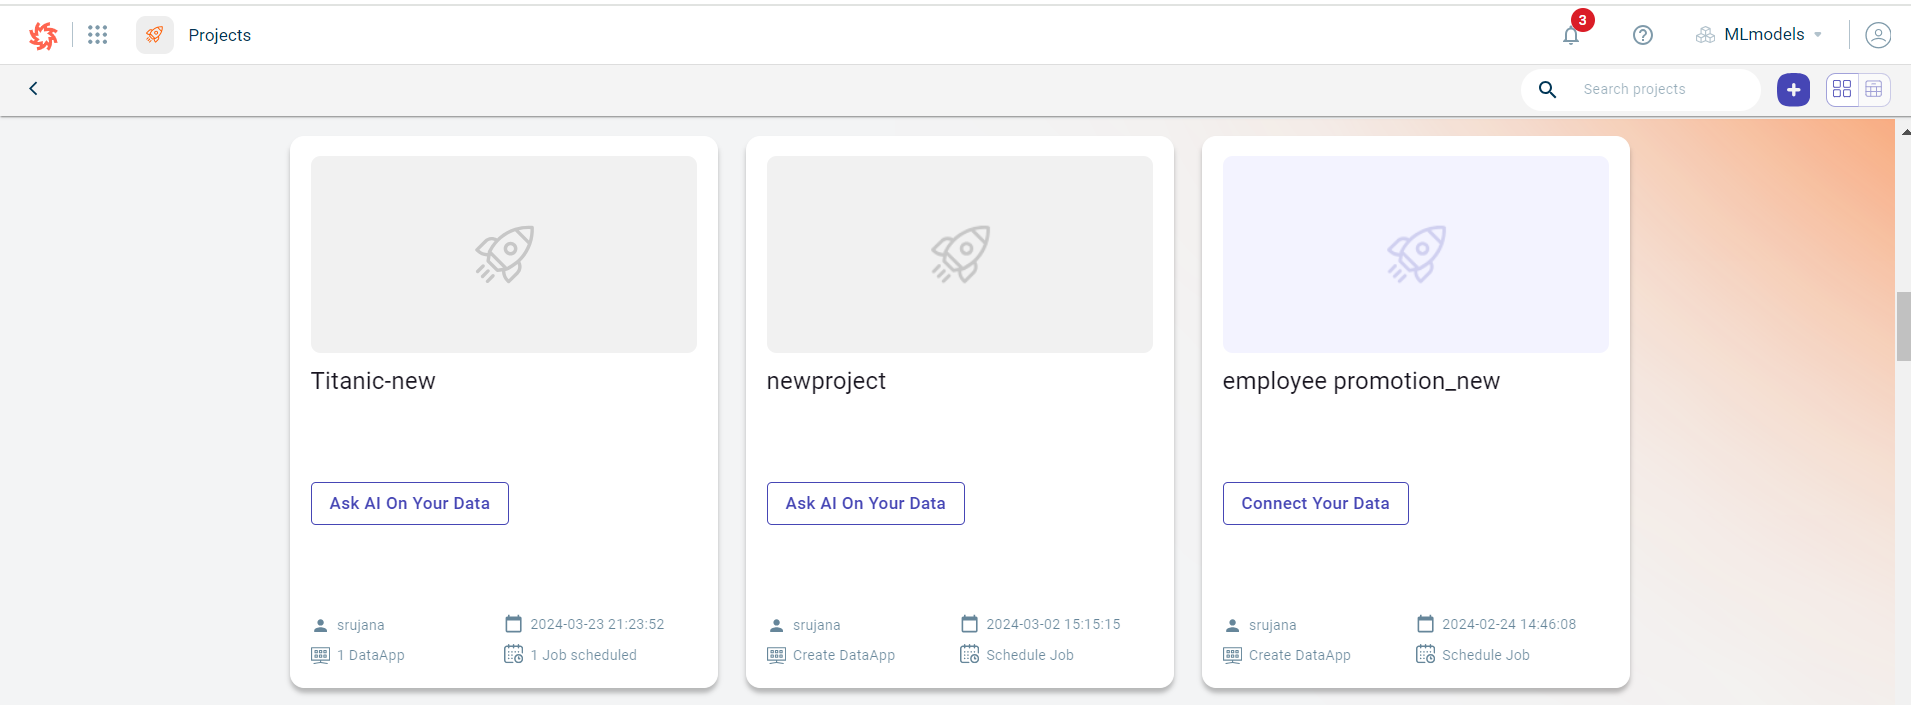
Switch from projects list view to card view: You can use this option to switch from list view to the card view.
The card view of projects appears.
Switch from projects card view to list view: You can use this option to switch from list view to the card view.
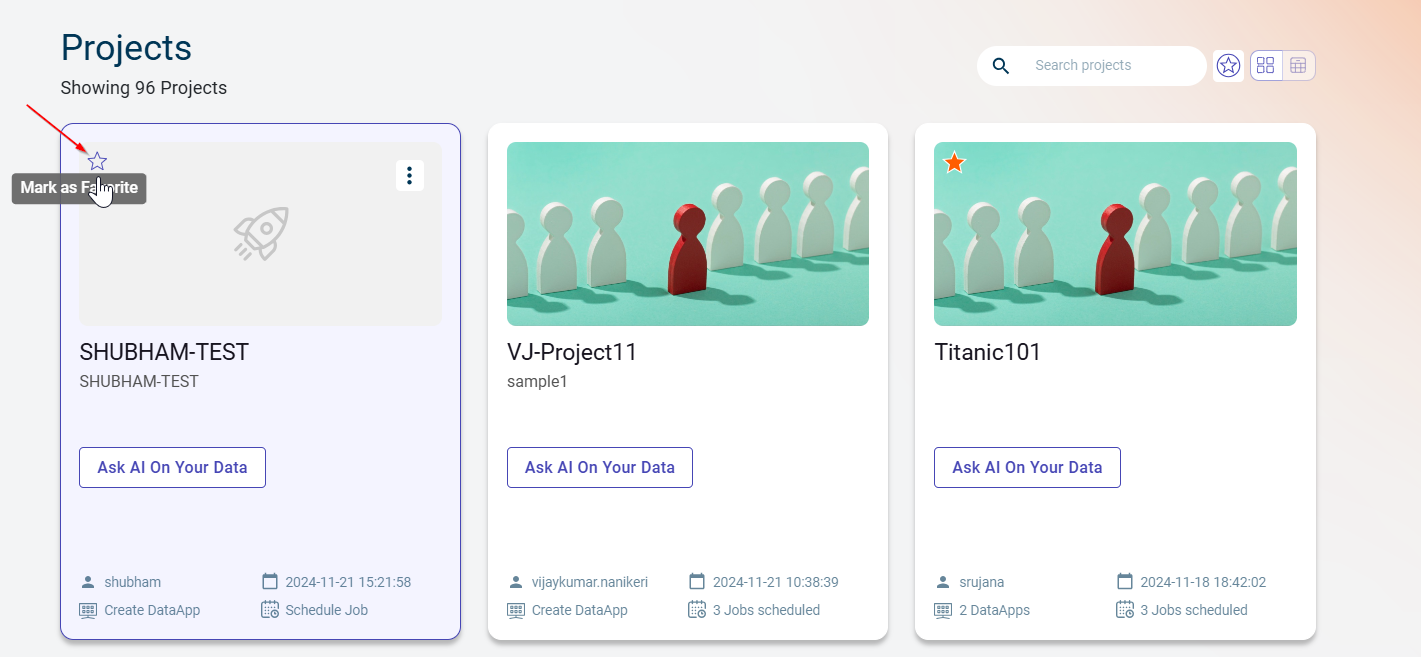
Favorite icon: You can use this option to mark the important projects as favorites.
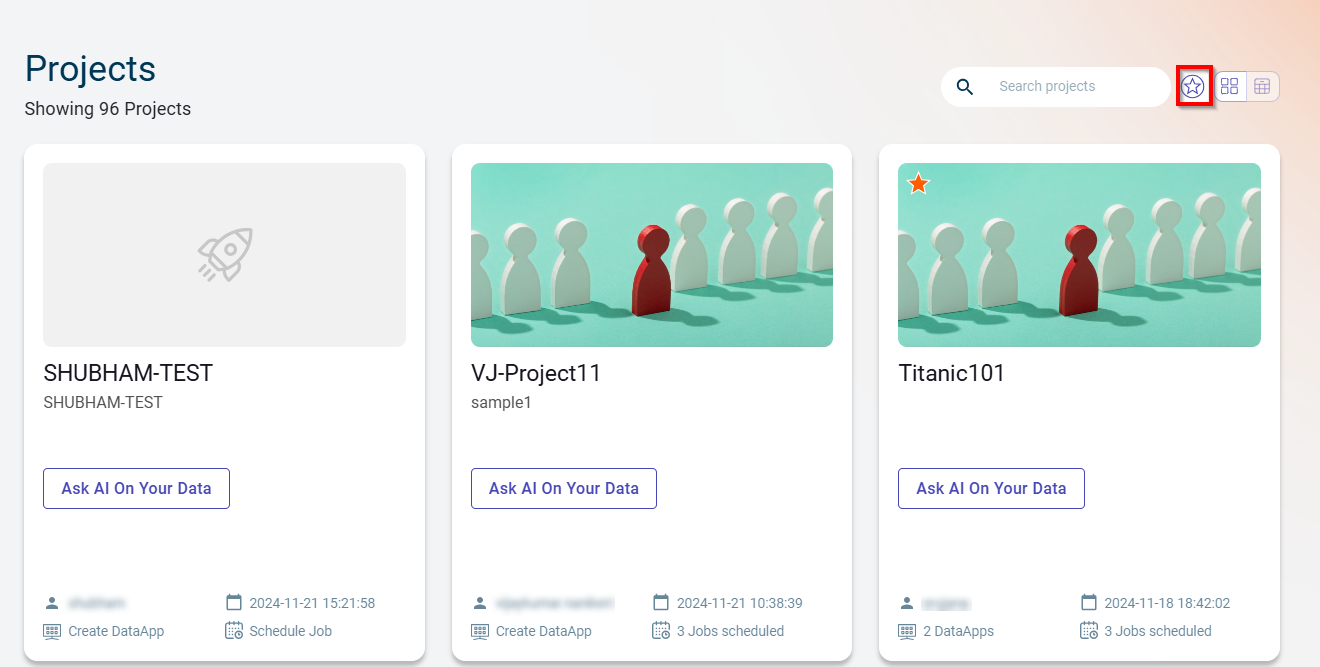
Favorite filter: You can use this option to narrow down the list to view only the favorite projects, particularly when managing a large number of projects.
Creating a project
Use this procedure to create a project in a tenant. After the project is created, you can develop flows.
Log in to the platform. The dashboard page is displayed.
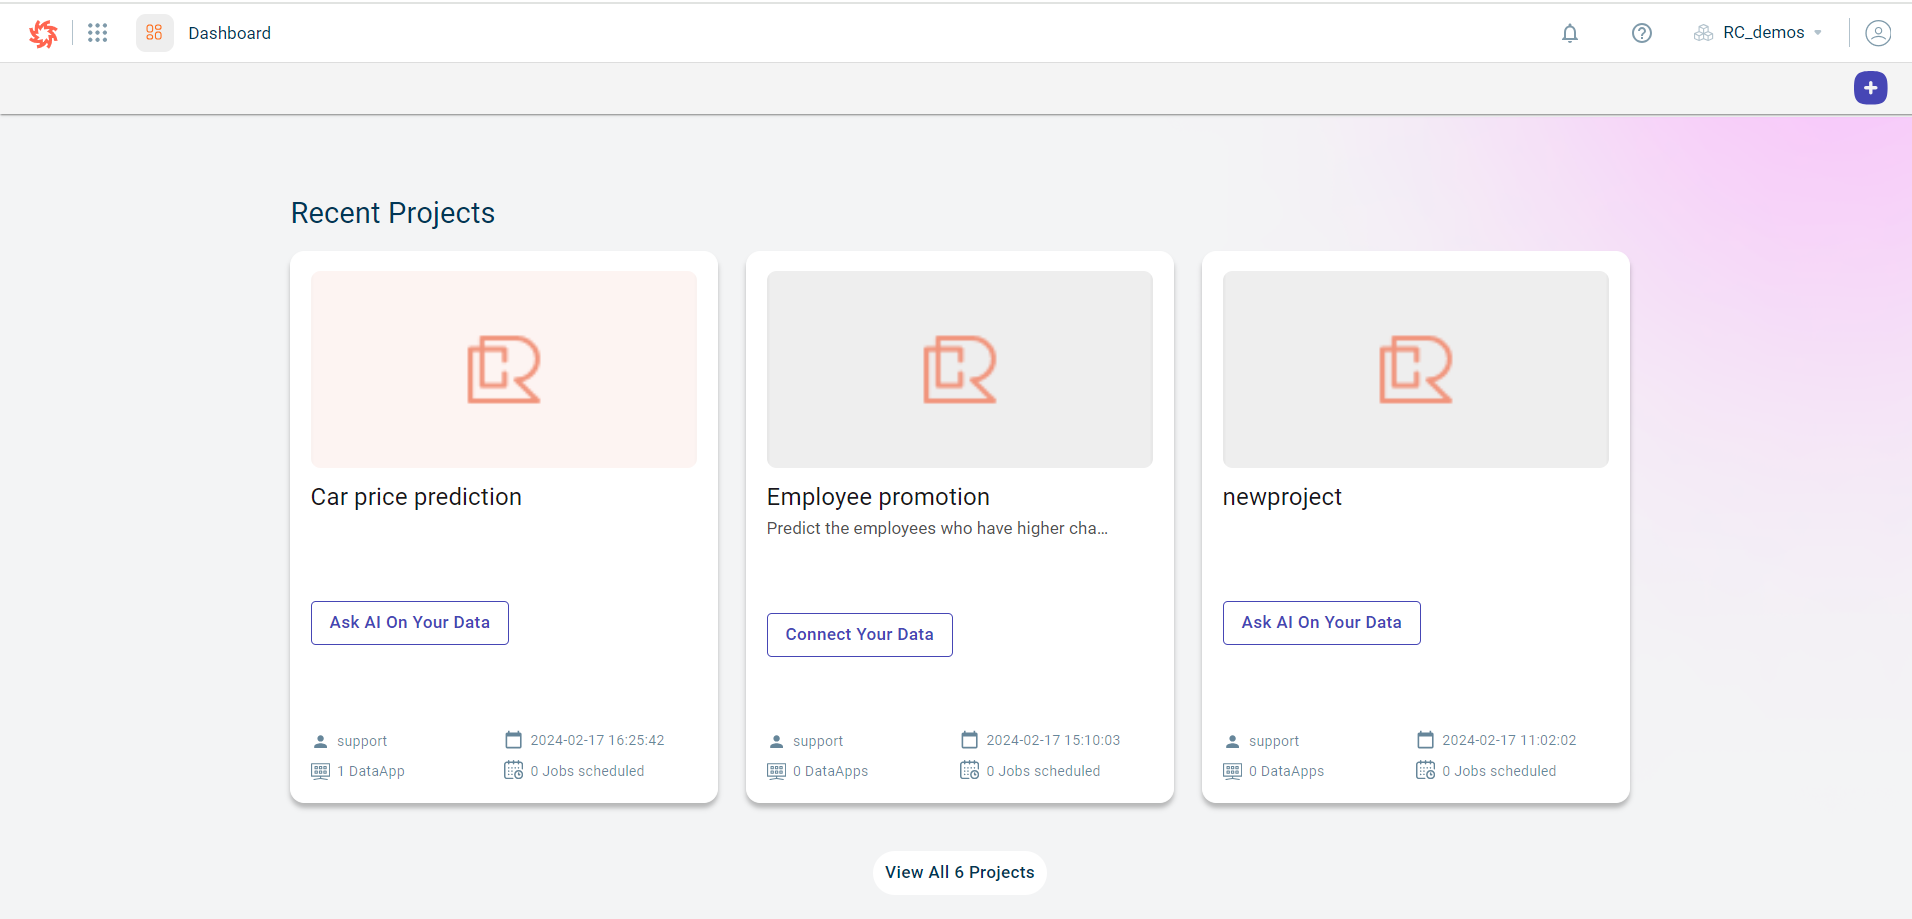
Do any of the following to create a project:
Click the plus icon
on the right corner of the page on the dashboard page.
Hover over the menu icon
and select Projects. The displays the Projects cards page where you click on the plus icon
The Create a new project window appears.
Specify this information:
- Project name:
The name of the project.
- Project description:
The brief description about the project.
- Project Preview Image:
Select an image from the available image gallery or navigate to the custom tab to choose the image from your local drive and click CHOOSE. If you do not upload any image, the platform by default selects a random image for the project.
Select the environment in which you want to run the project by expanding the Advanced Settings section. If no environment is selected, the project will run in the default environment. To create an environment, see creating an environment.
Click Create Project. Once the project is created, you are redirected to the canvas view page where you upload the dataset to build machine learning flows.
Duplicating a project
You can use the following procedure to create a copy of an existing project in the same or a different tenant.
Go to The project cards are displayed.
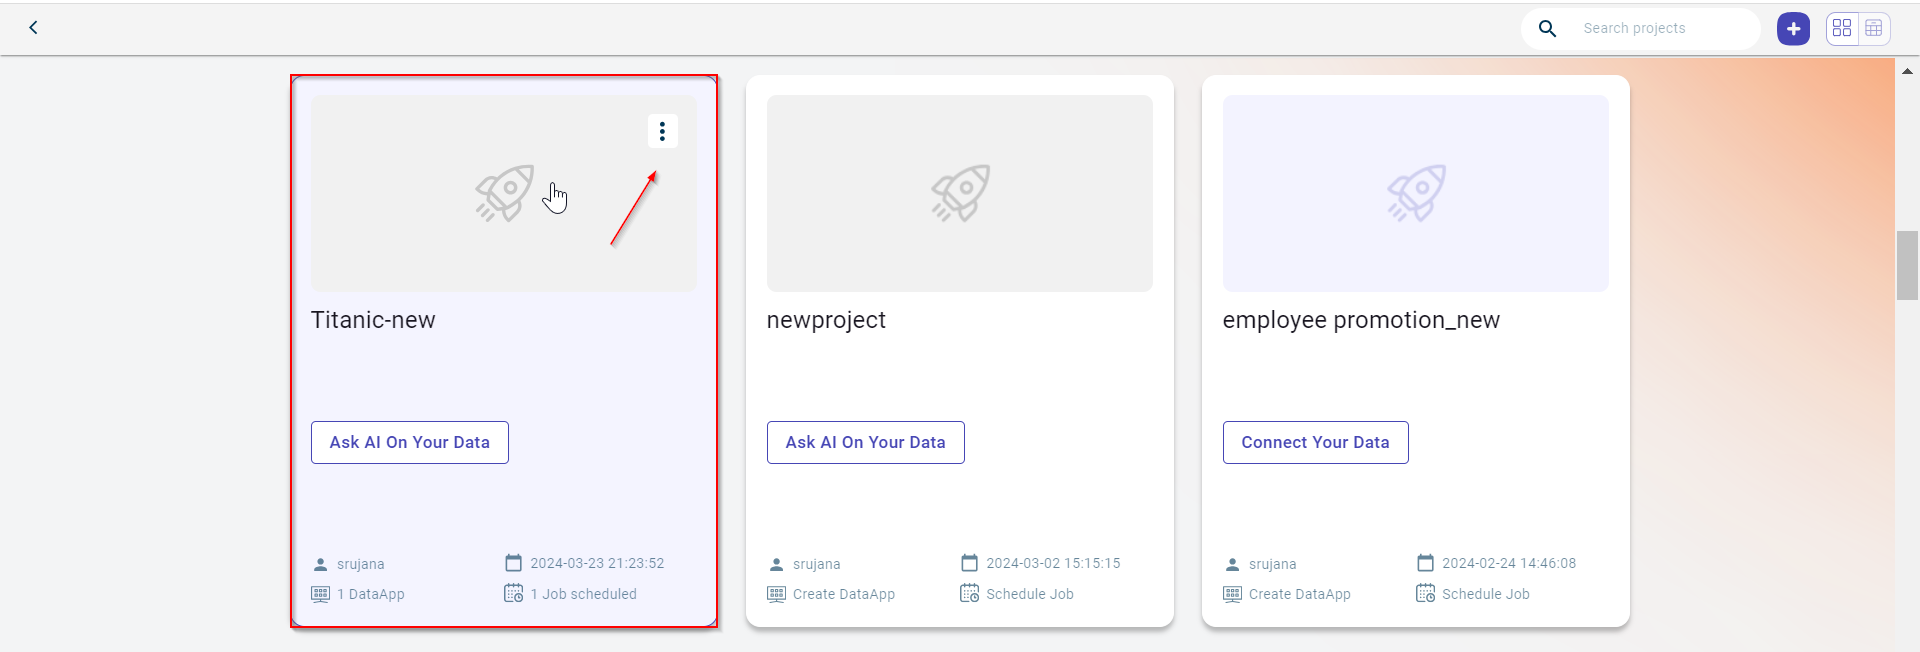
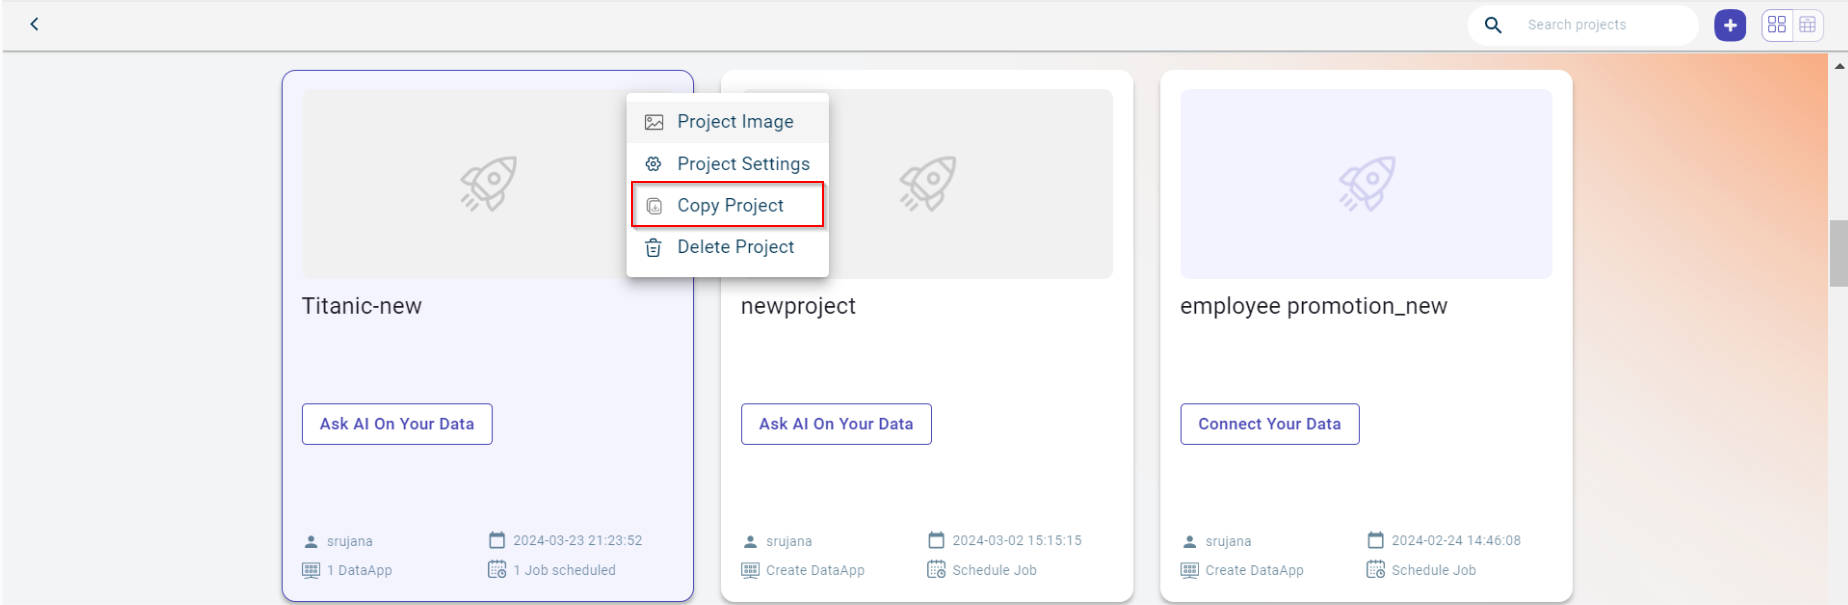
Click the ellipses icon on a specific project that you want to duplicate and select Copy Project.
You can view ellipses icon upon hovering on the project card.
This opens the dialog with all the conditions. If you agree to all the points mentioned, then proceed further.
Click Proceed. This opens the Copy Project window.
Specify the custom name for the copied project. Else, this will be created with the name as copy of source project name.
Select the DataApps and prediction services that you want to copy to the duplicated projects from the source project.
By default, the environment is set to default.
Select the workspace to which you want to copy this project to.
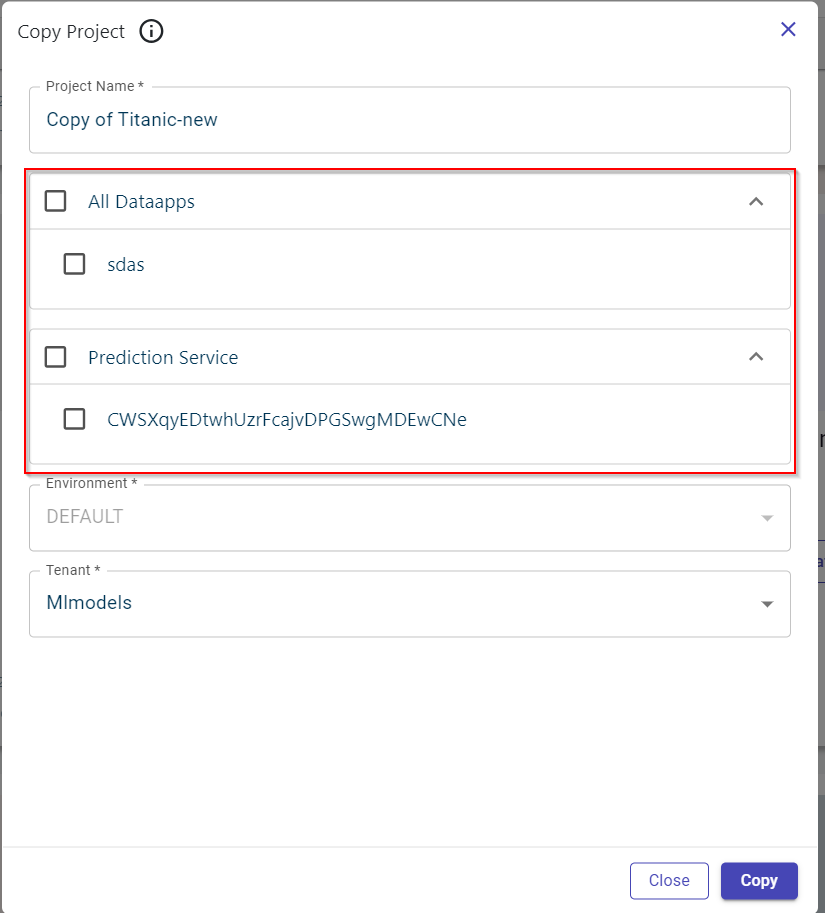
Click Copy to create a copy of the existing project on the Projects page of the selected tenant.
Notes:
When duplicating a project, all components—including Prediction Services, Environments, and DataApps (Excluding Job type DataApp)—are seamlessly copied to the new project. Additionally, you can selectively include DataApps and Prediction Services from the source project by checking the corresponding check boxes during duplication.
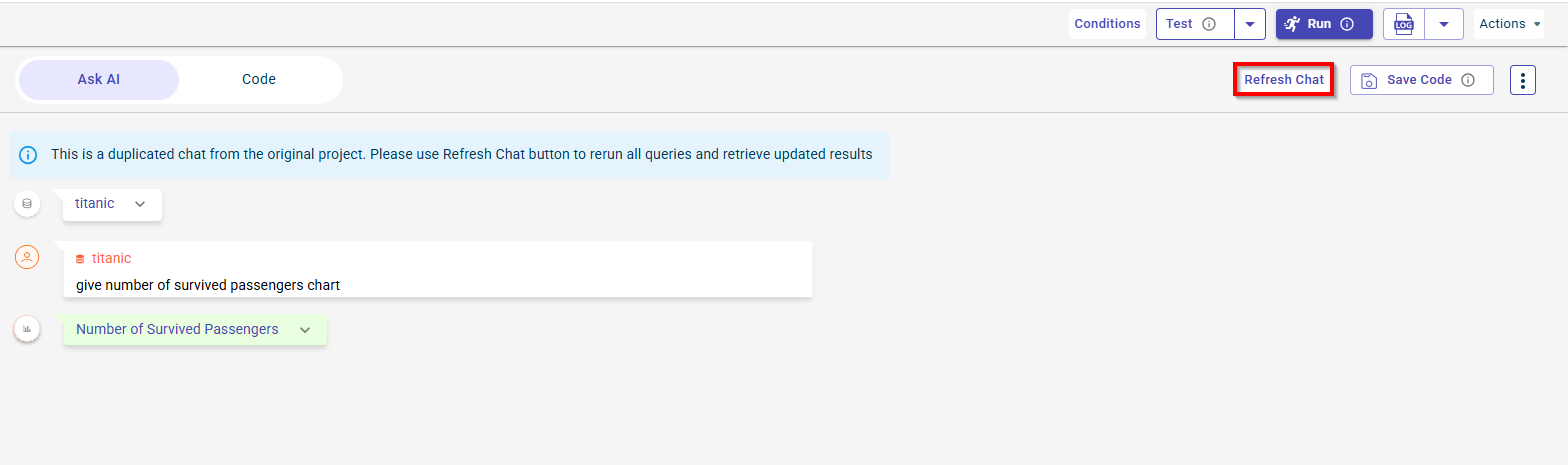
Chat conversations within AI-Assisted Recipes are now duplicated, ensuring the context and interactions are preserved. To view the duplicated chats, navigate to the AI-Assisted Recipe page and click Refresh Chat to rerun the queries and retrieve the updated results.
Upon importing components into a new project, they will initially appear in an unbuilt state:
For datasets imported via local files, use the Add File option to upload the dataset. This option becomes available when you right-click on the dataset block.
For datasets imported through connectors, use the Reload option, which can also be accessed by right-clicking on the dataset block.
When you run the duplicate project, all the components in the data pipeline will be assigned a new name.
Fivetran connectors are not supported in the copy project feature.
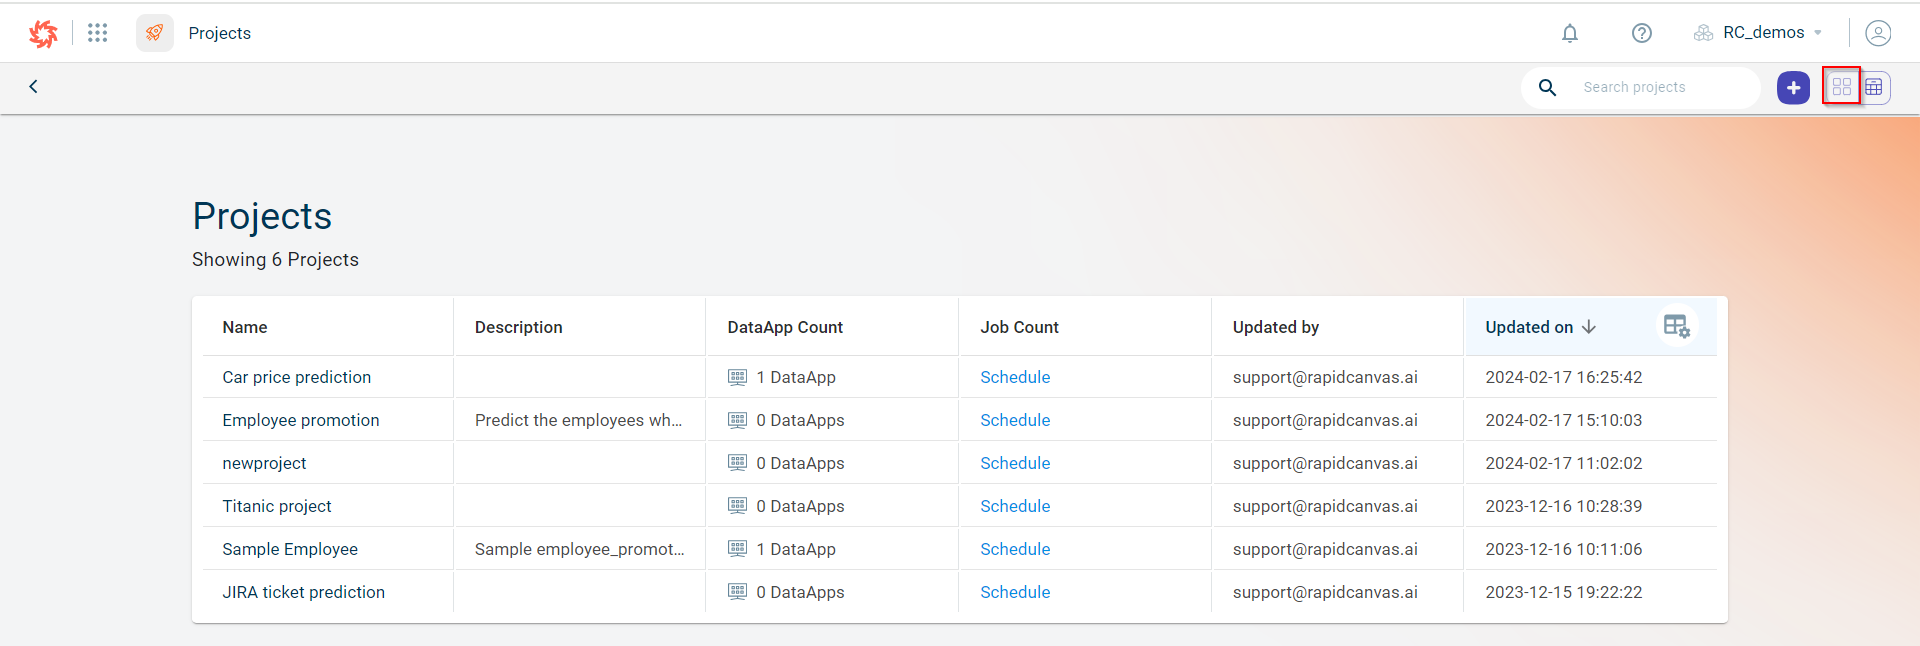
Reviewing the Projects listing page
Use this procedure to review the projects in the list view.
Go to The project cards are displayed.
Click the list view icon
 on the right corner of the projects page. The list of projects are displayed.
Review the project information:
- Name:
The name of the project. Clicking on the link takes you to the canvas page of the project.
- Description:
The description of the project.
- DataApp count:
Displays the total number of DataApps created in a project. If there are no dataapps created, you can use the Create option to navigate to the DataApps page of the project to create one.
- Job Count:
Displays the total jobs created in a project. If there are no jobs created, you can use the Schedule to schedule a job run to run the data pipeline at the specified time interval. In case there are jobs, this takes you to the Jobs page.
- Updated by:
The user who has last updated the project.
- Updated on:
The date on which the project was last updated.
Use the table settings icon to select or deselect the columns you want to view in the table. You can also change the order in which columns are displayed in the table, using the reordering option.
Modifying the project settings
Use this procedure to modify the details of a project. You can use the ellipsis icon in the card and list view to edit the details.
Select a project that you want to modify.
Do one of the following:
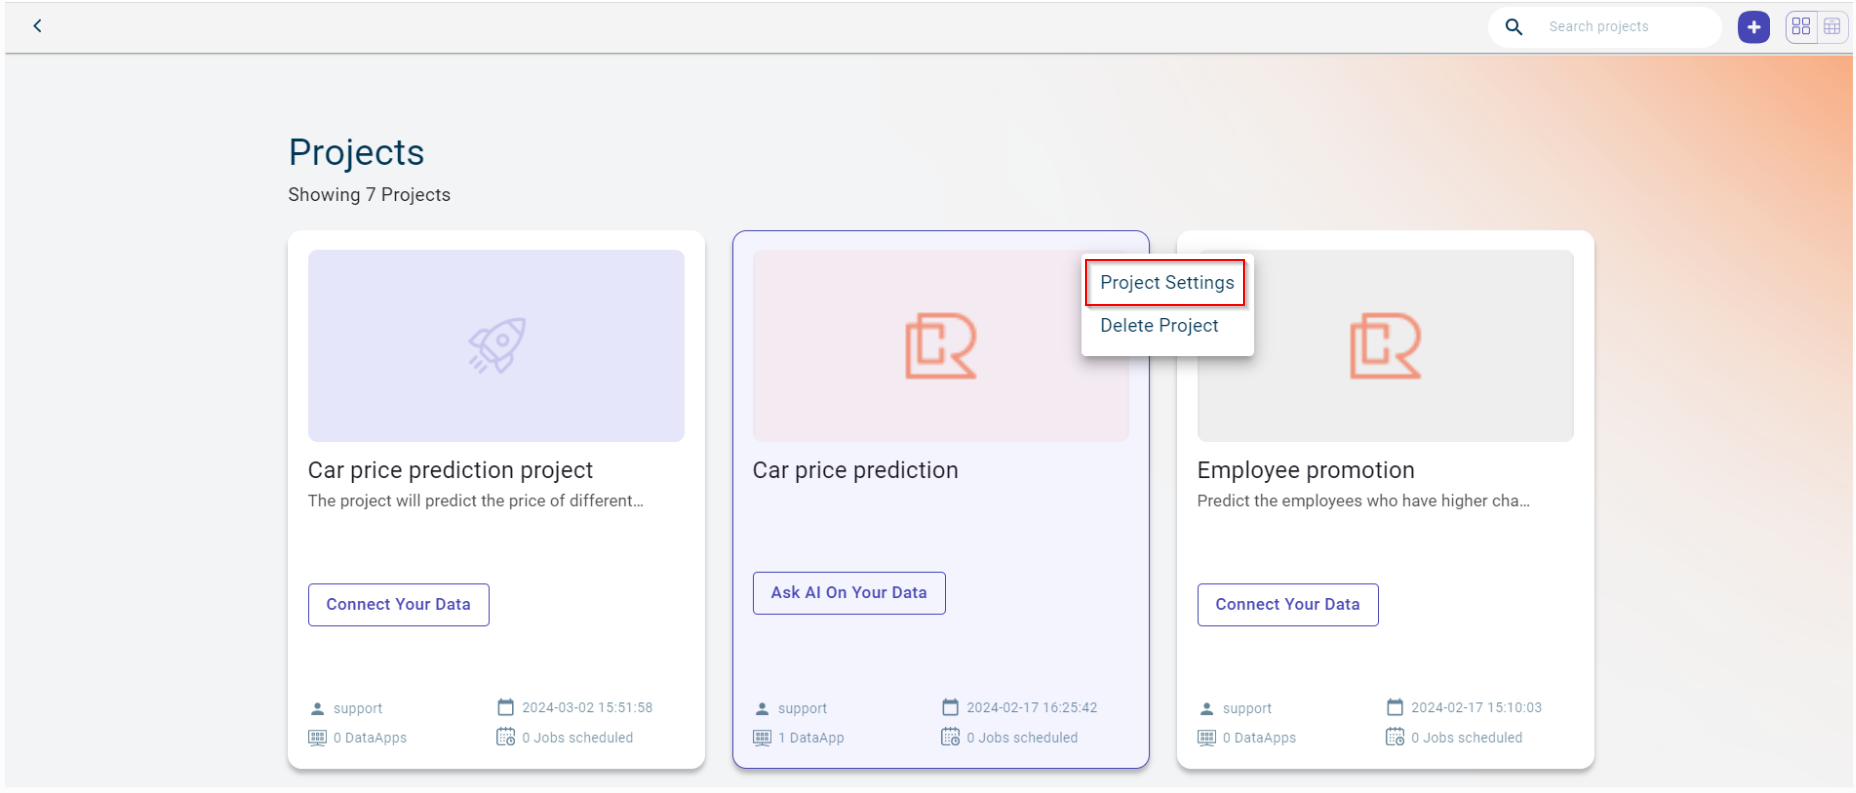
Click the ellipsis icon on the project card and select Project settings.
In the list view, you can view the ellipses icon when you rest the pointer on the project name and click Settings
Click on the project. This takes you to the canvas page where you can select Settings from the project left navigation menu to modify the project details.
The side panel is displayed.
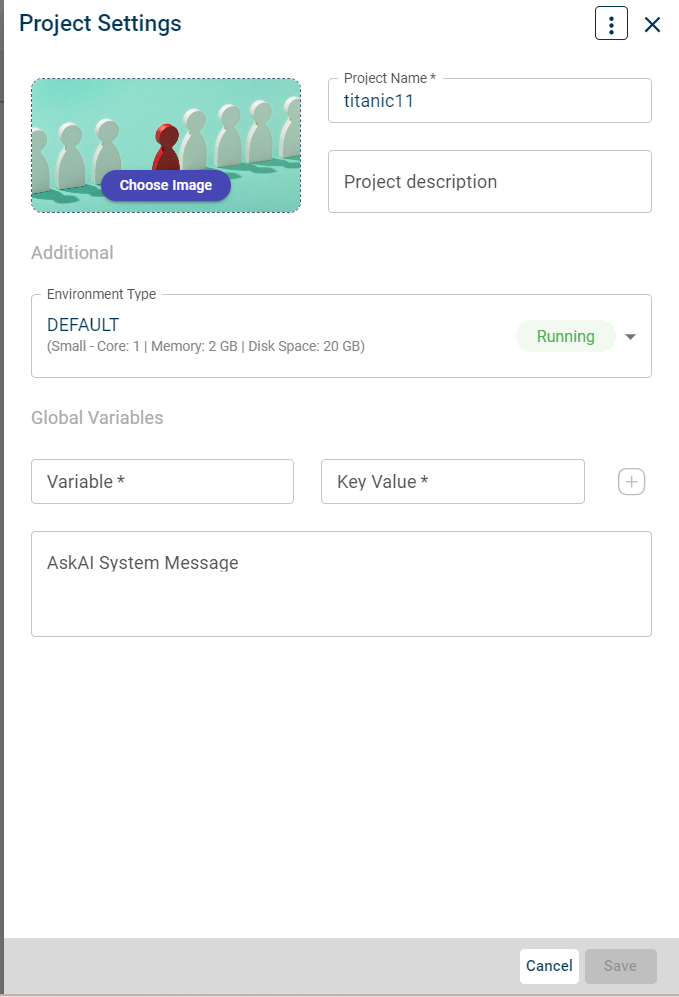
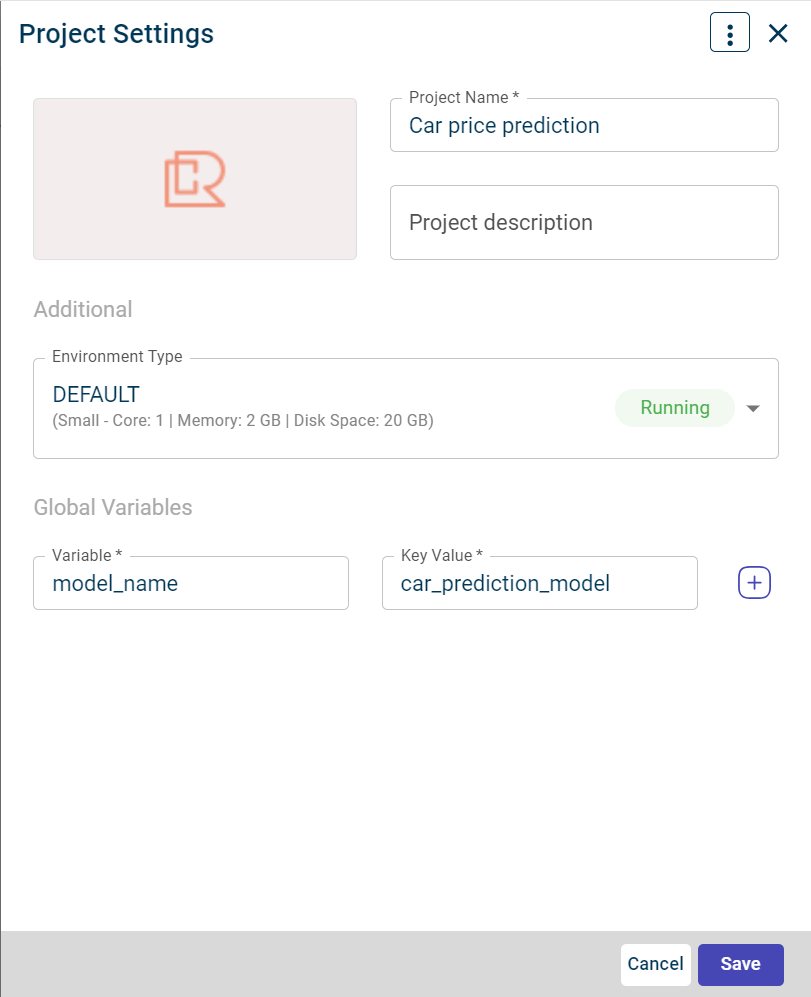
Modify the required details.
Add project variables by mapping a variable and a key value. You can add multiple project variables to a project. See Adding a global variable
Provide the AskAI System message that the AskAI will consider for the project while running the prompts and generating the recipes.
click Save.
Deleting a Project
Use this procedure to delete a single project created in a tenant.
Select a project that you want to delete.
Click the ellipsis icon
 on the project card which you want to delete and select Delete Project.
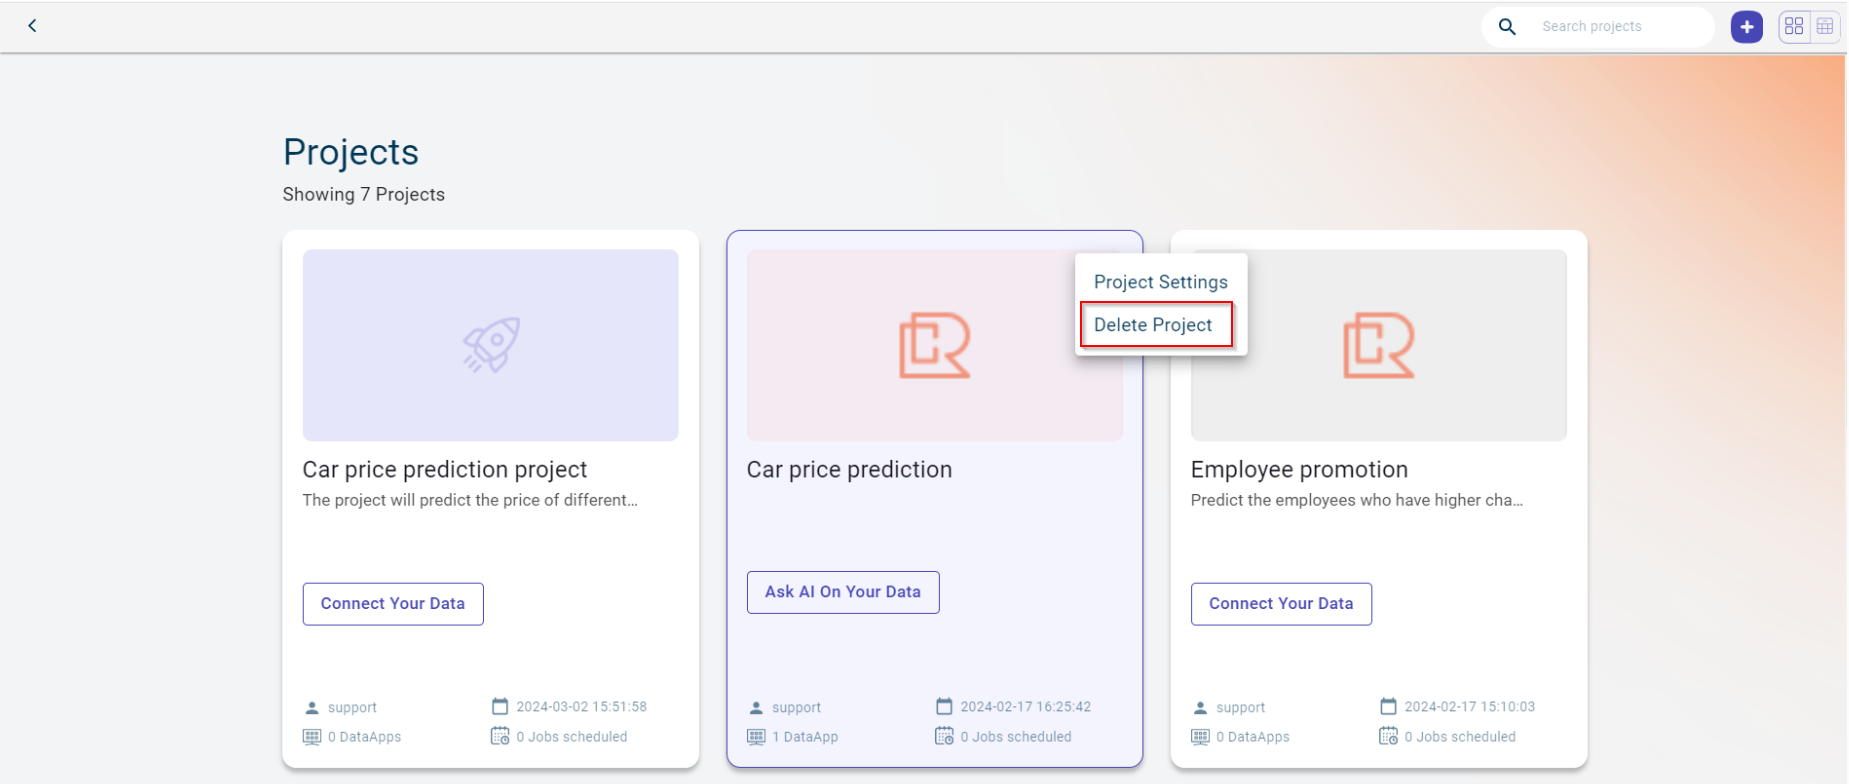
A dialog box prompts to delete or cancel the project. Click Delete to delete the project permanently from the list and tenant.
Note
Click Cancel to discard the action.
Deleting Projects in Bulk
Use this procedure to delete multiple projects at once in a tenant.
Log in to the platform. The dashboard page is displayed.
Hover over the menu icon and select Projects.
Switch to the list view of projects.
Select the check boxes for the projects you want to delete. Once selected, the Bulk Actions option will appear.
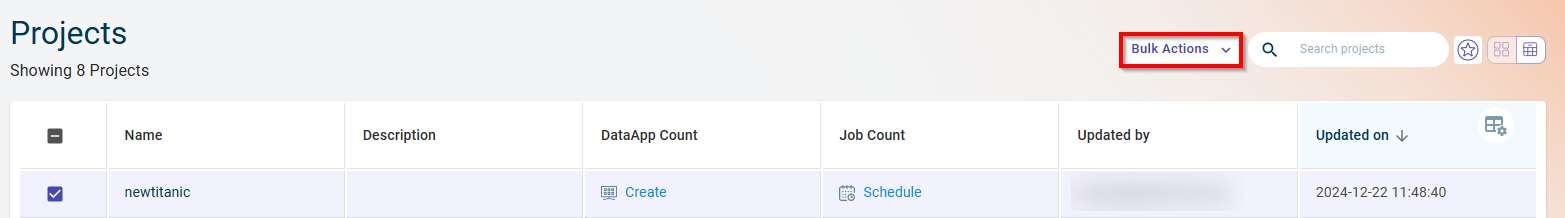
From the Bulk Actions drop-down, select Delete to remove the selected projects. A confirmation box will appear.
Click Yes to confirm and delete the selected projects.
Project-level navigation
The Canvas is the page displayed after you click on any project. You can see the following options on the canvas workspace of a project.
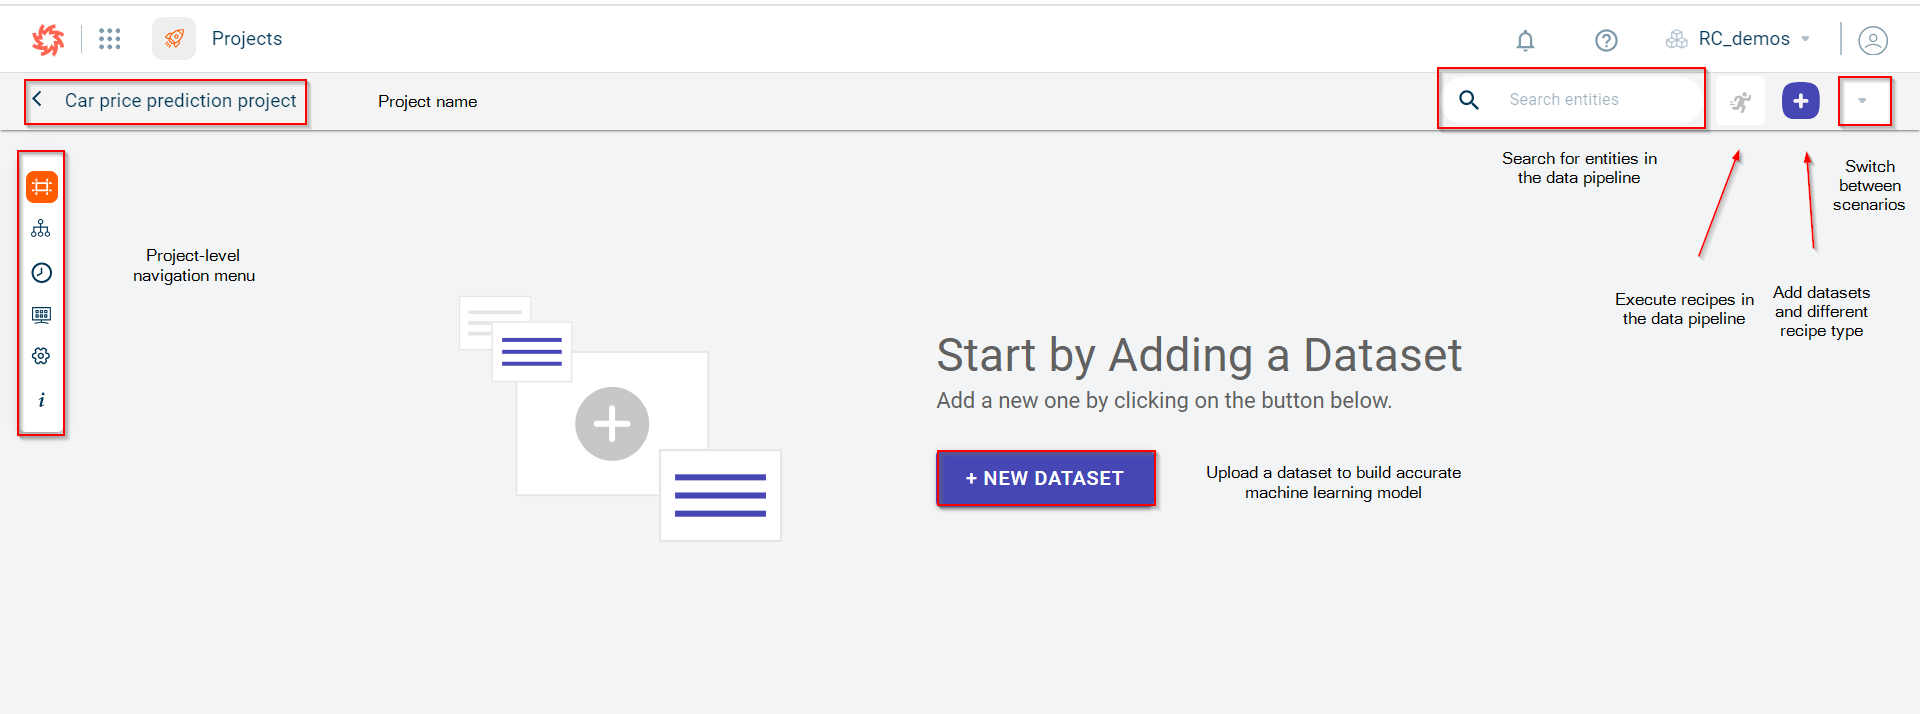
Project-level navigation menus - These menus are located on the left side of the screen and contain quick links to:
Canvas. This is the canvas where you can build data pipelines. To learn working on the canvas, see Canvas Overview
Scenarios. This is where you can view all scenarios created for this project. To learn creating scenarios, see Scenarios
Jobs. This has the list of jobs scheduled for this project. To set up project job runs, see Jobs
DataApps. This shows the dataapps created for this project. To create and run dataapps, see DataApps
Prediction Job. This shows the prediction jobs created in the project. To create and manage prediction jobs, see Prediction job
Settings. This enables you to change the project settings. To change project settings, see Editing the project details
About. This has the summary of overall project. You can generate the content for the data pipeline with AI-assistance. The significance of each entity in the data pipeline is explained by the AI.
Configuring project variables at the project level
Global variables are defined at the project level. Once defined, the variables can be used to store artifacts and models built on the training dataset in a project. You can reuse the key value of the global variable to configure values during scenario execution. You can store the models and artifacts created for a particular segment in the configured values at the scenario level.
The global variables can also be configured in a transform within a recipe to execute the recipe in a flow only if the condition is satisfied.
The global variables section can be viewed on the platform only after creating a project.
To configure global variables in a project:
Select a project in which you want to configure the global variables.
Click the ellipsis icon
on the project card and select Project settings. The Project Details page is displayed.Add the key value pair in the Project variables section.
Note
To add multiple key-value pairs use the + icon corresponding to each field. You can delete a key-value pair, using the delete icon.
Click SAVE.
Working on a project
Use this procedure to build ML flow within this project. The hardware configured will run the flow in this project.
Click on a specific project in which you want to create a data pipeline. By default, you land on the Canvas page to build the data pipeline using the template, AI-assisted or Rapid-model recipes.
Click the plus icon
and select Dataset, else click +New Dataset on the canvas workspace to upload the dataset. The later option can be viewed only in a project with no flows.
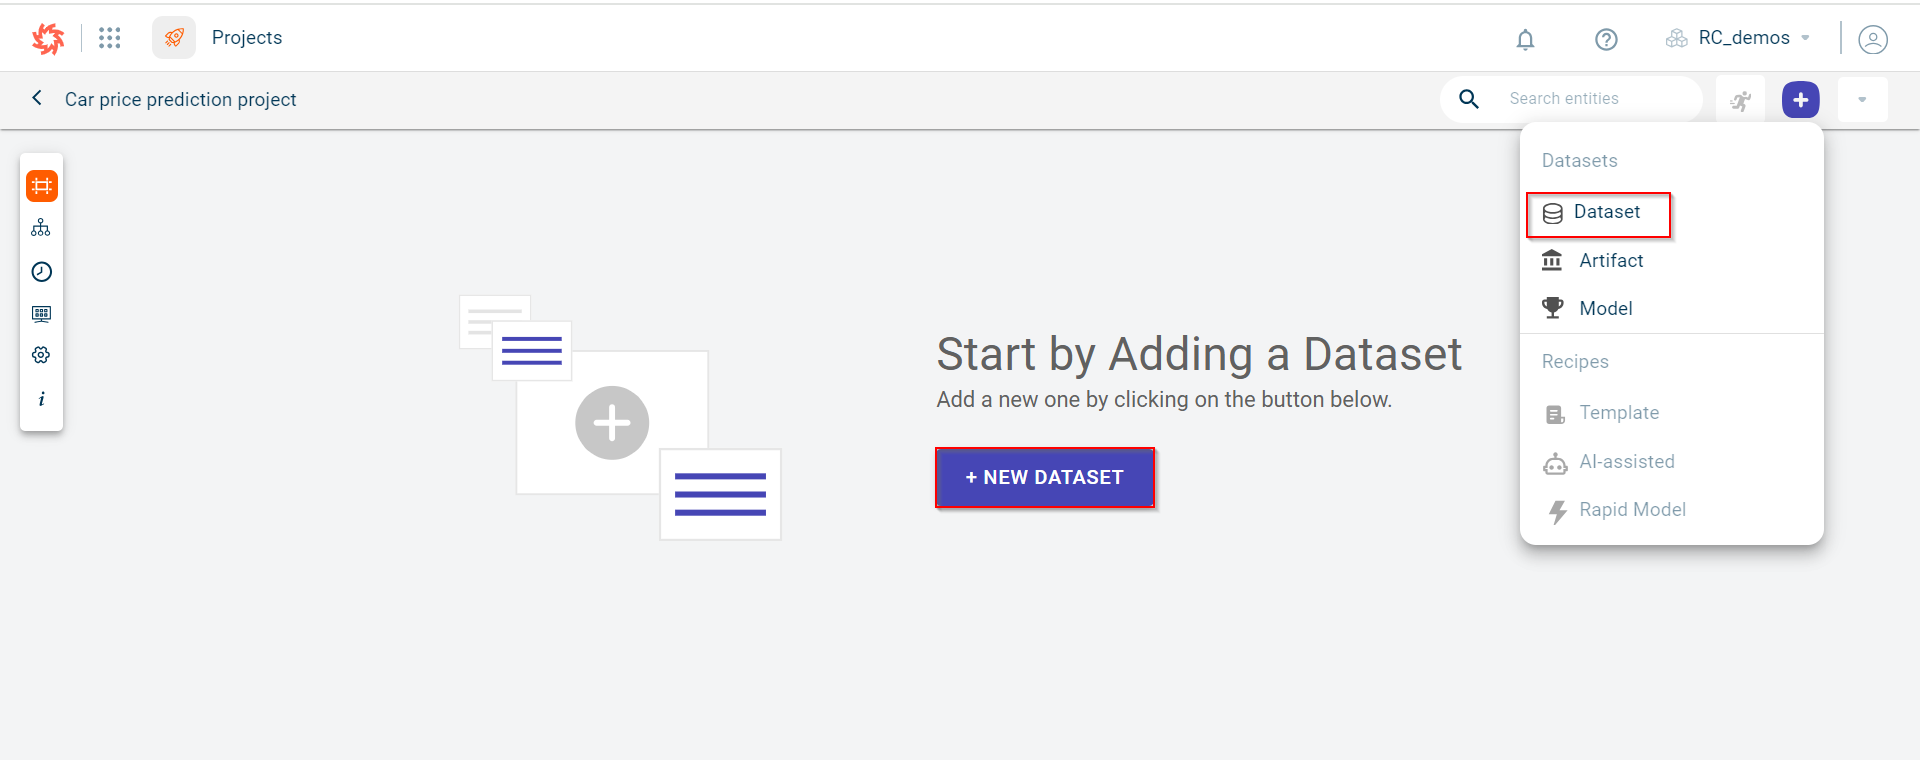
Once uploaded, you can see the dataset icon on the canvas.
Click the dataset icon to open the side panel to select the recipe type you want to run on the database to perform data transformations.
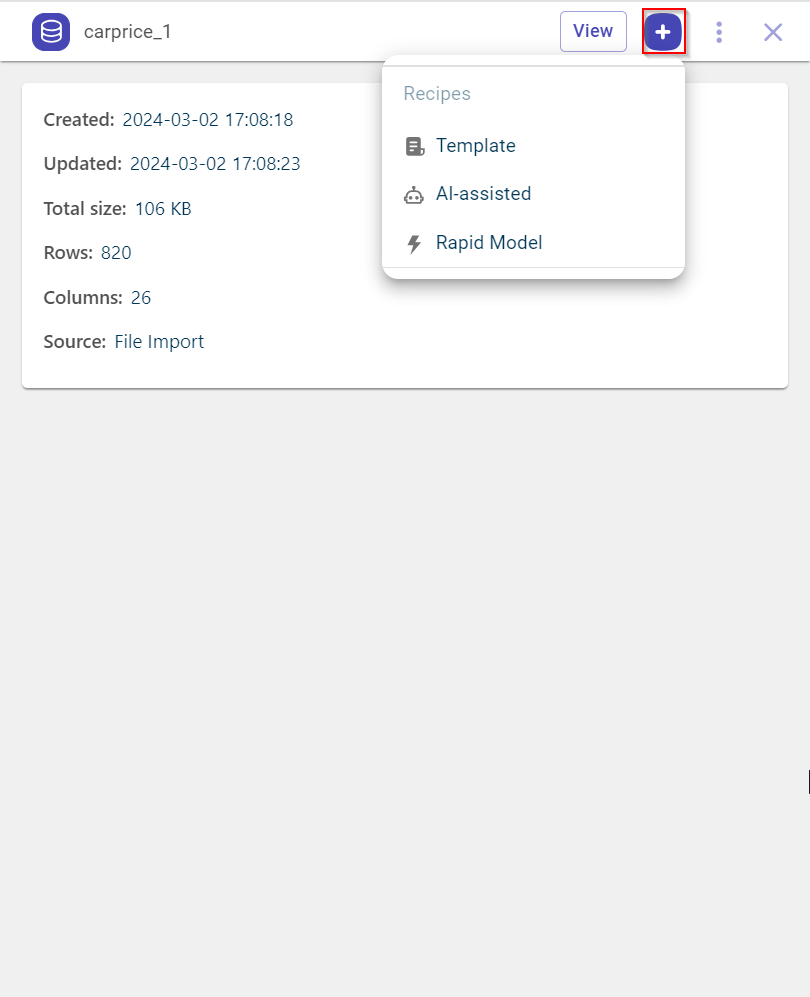
Click the plus icon
and select the recipe type from the following options:
Template
AI-assisted
Rapid Model
Select Template to add the recipes to the data pipeline and perform data transformations from the available list of predefined standard templates.
Here, we are explaining by selecting the template recipe type. This takes you to the template recipe page.
Click Transformations on the Template recipe (standard recipe) page.
Select the transform based on the transformation you want to perform on the dataset. For example, select EDA Data Profiler.
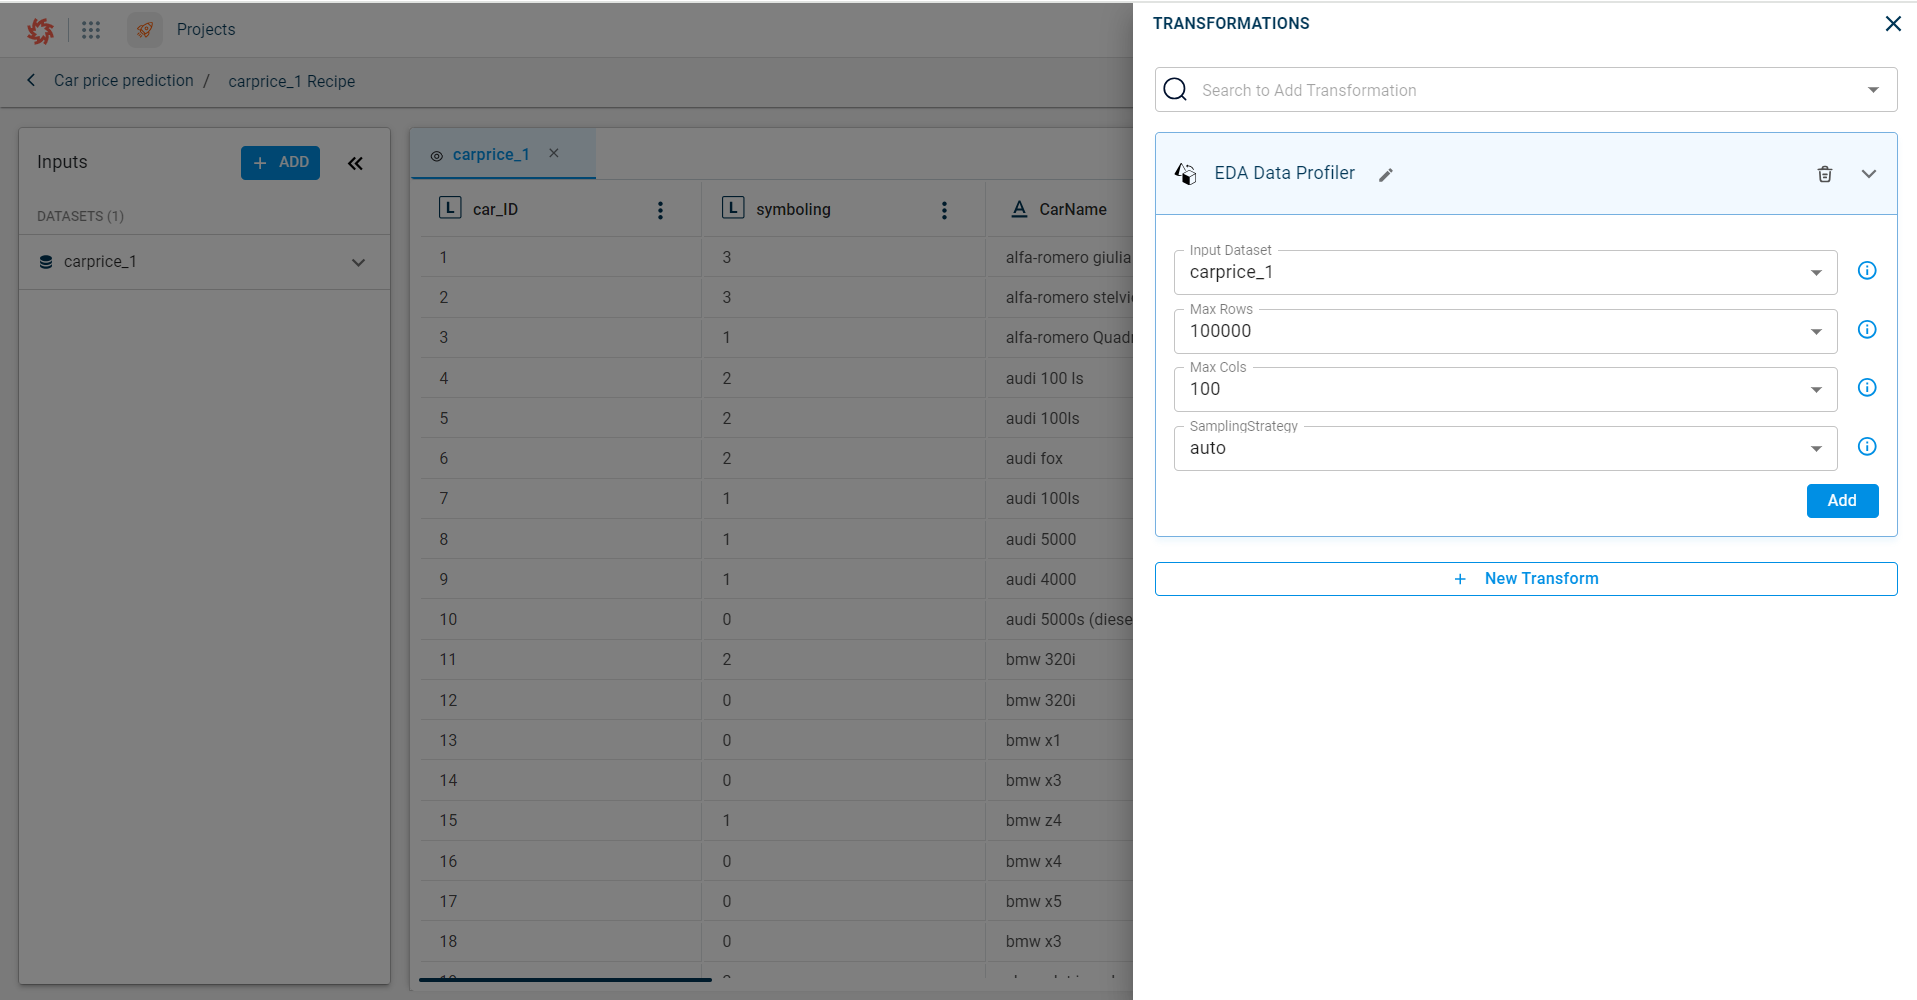
Click Add to add this standard template into the pipeline. Once you add, you can see the recipe icon on the canvas.
Click Run to run this recipe in the pipeline and generate the output, which can be a dataset, chart or both.
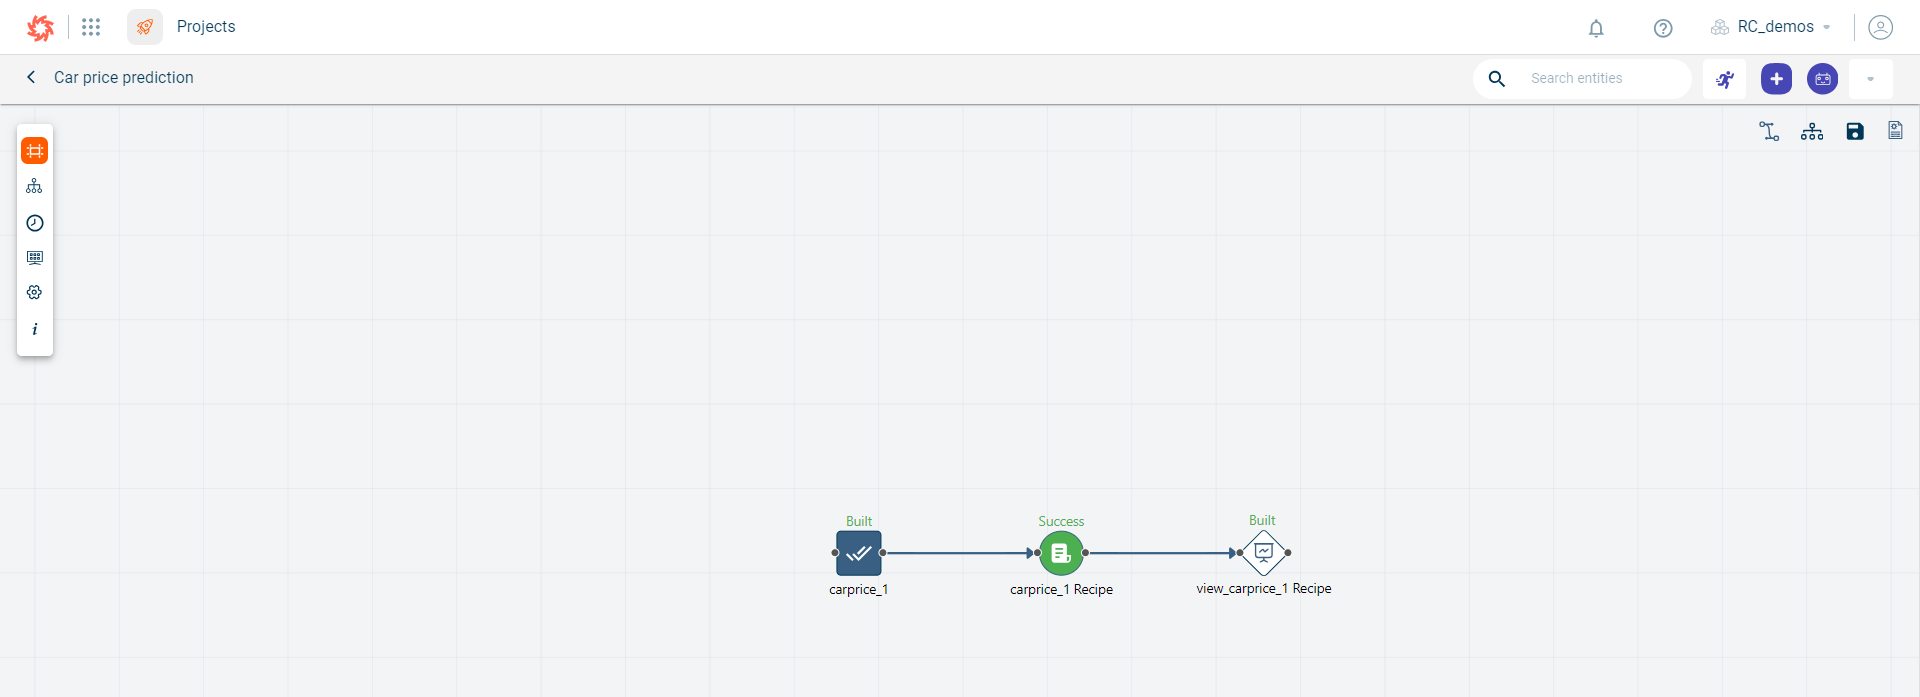
Generating the about content for the project
Use this procedure to generate the content that summarizes the project.
Select a project for which you can to generate the content. You are navigated to the Canvas view page.
Select About from the project level navigation.
Click Generate Content to generate the content for the data pipeline. The AI generates the content explaining about the recipes and datasets used in the pipeline briefly.
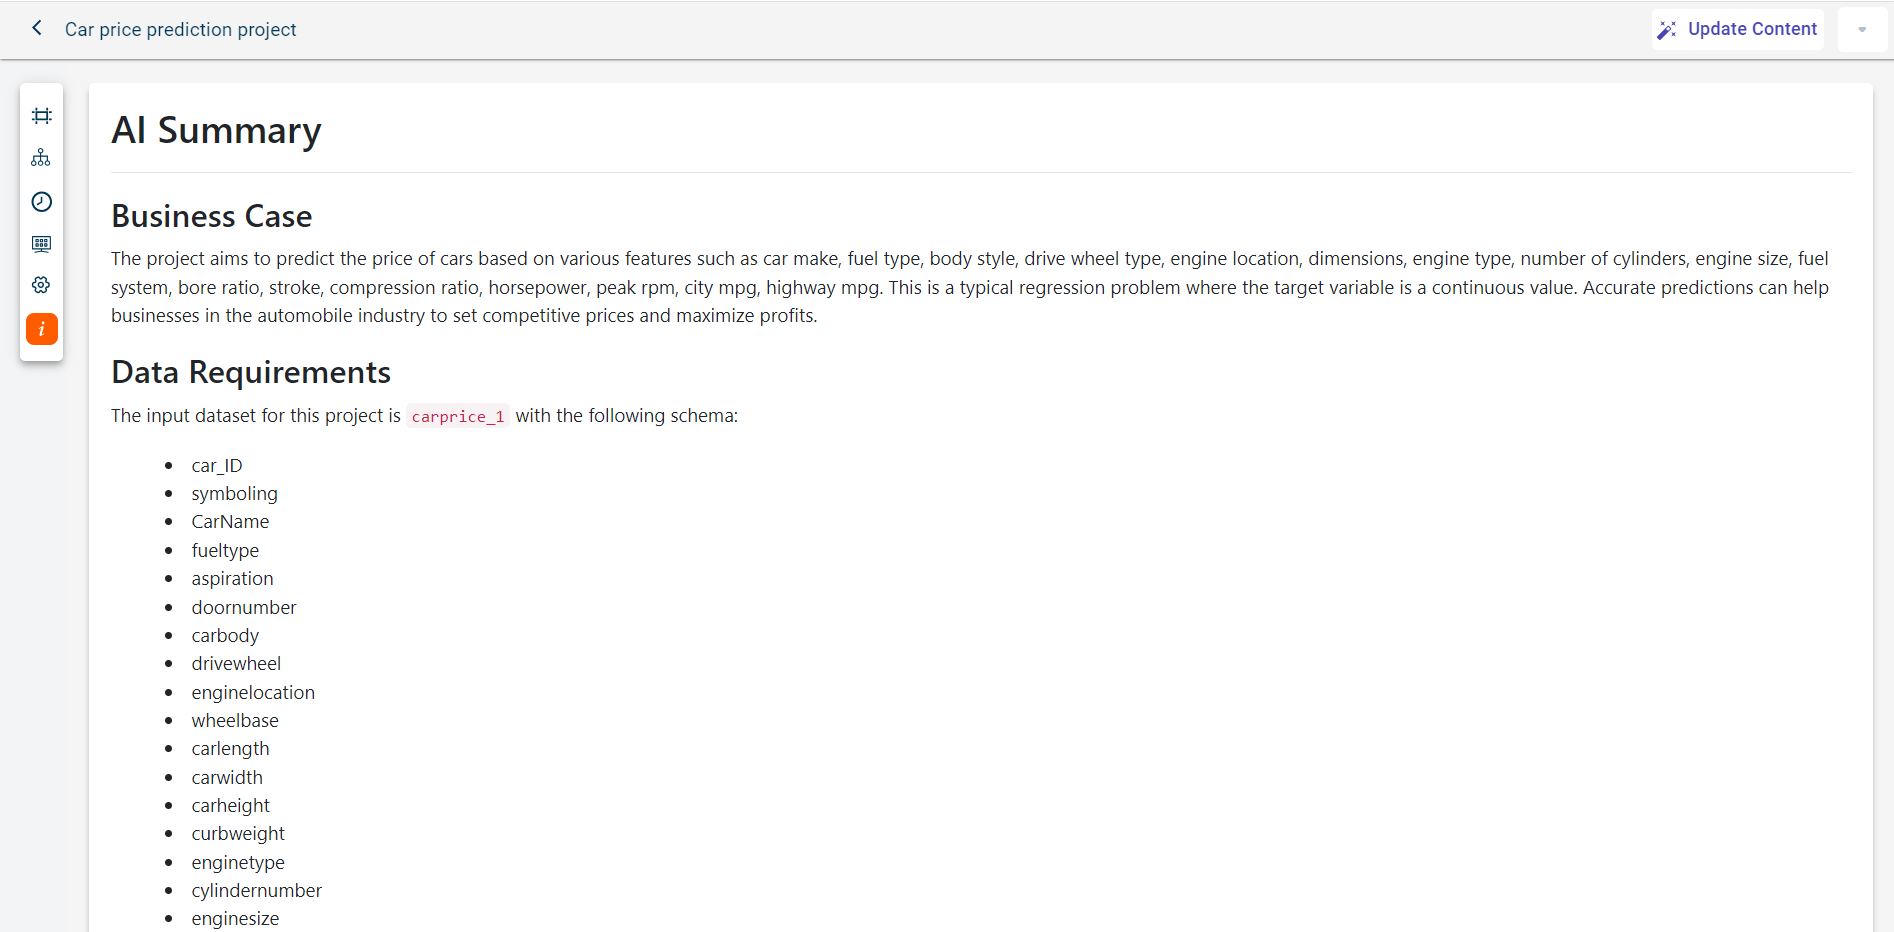
You can do the following actions on this page:
If you have made any changes to the data pipeline or machine learning flow, you can use Update Content option to update the content.
To delete the about content, click the Actions icon and select Delete.
Generating AI snippets for each node on the Canvas
Use this procedure to generate the AI snippet for each node on the canvas. The AI snippet explains the significance of each node and the action performed by the node.
Select a project for which you can to generate the snippets for each node.
Click the Snippet generator icon on the canvas.
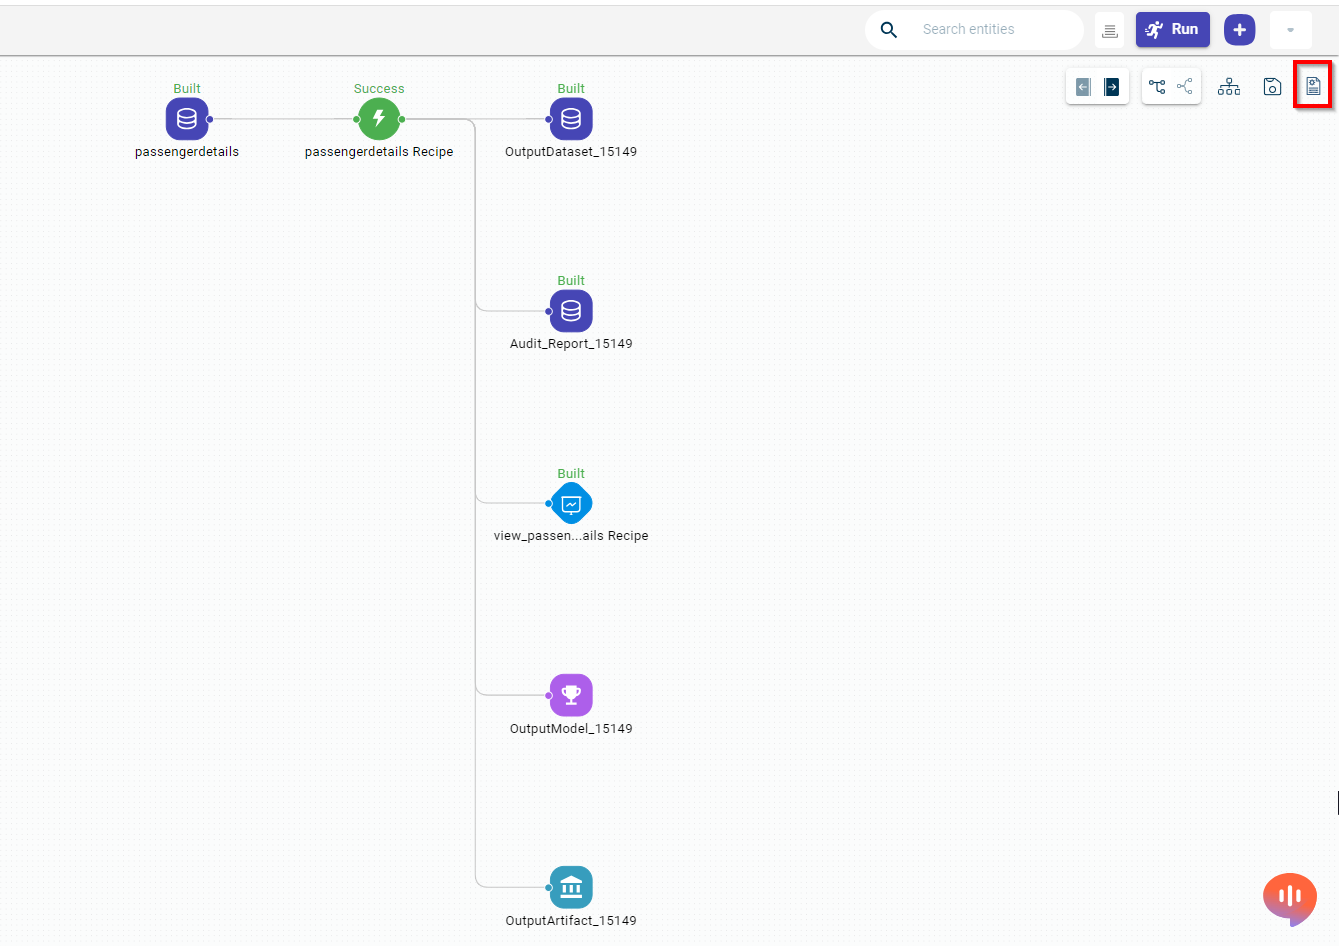
This displays the AI content dialog.
Click Generate to generate the AI snippet for each node explaining about the significance of each node.
Click on any of the nodes on the canvas. This opens the side panel with the AI snippet section where you can check the significance of each node.
You can always use the Update Content option to revise the snippet content if you make any changes to the node or the data pipeline.