Undersample timeseries data
This transform reduces the data collected over time and retains the general pattern of the data by allowing users to aggregate values based on the frequency, which can be by hour, week, month, or year. One of the aggregation methods, such as mean, max, min, or median, is applied to the numerical value column of the grouped data.
Parameters
This table provides a brief description about each parameter in Undersample timeseries data transform.
- Name:
By default, the transform name is populated. You can also add a custom name for the transform.
- Input dataset:
The file name of the input dataset on which this transform must be applied. You can select the dataset that was uploaded from the drop-down list.
- Group by:
The column based on which the time series data is grouped.
- Timestamp:
The name of the timestamp column in the dataset. The name should be as is in the dataset.
- Frequency:
The frequency at which the time series data is undersampled. Possible values:
B - business day frequency
C - custom business day frequency
D - calendar day frequency
W - weekly frequency
M - month end frequency
SM - semi-month end frequency (15th and end of month)
BM - business month end frequency
CBM - custom business month end frequency
MS - month start frequency
SMS - semi-month start frequency (1st and 15th)
BMS - business month start frequency
CBMS - custom business month start frequency
Q - quarter end frequency
BQ - business quarter end frequency
QS - quarter start frequency
BQS - business quarter start frequency
Y - year end frequency
BY - business year end frequency
YS - year start frequency
BYS - business year start frequency
BH - business hour frequency
H - hourly frequency
min - minutely frequency
S - secondly frequency
ms - milliseconds
us - microseconds
N - nanoseconds
- Resample Type:
The method used to calculate the aggregate value for the selected frequency. Possible values:
Mean
Median
Max
Min
- Ouput dataset:
The file name with which the dataset is created. This file has the aggregate values for the selected frequency.
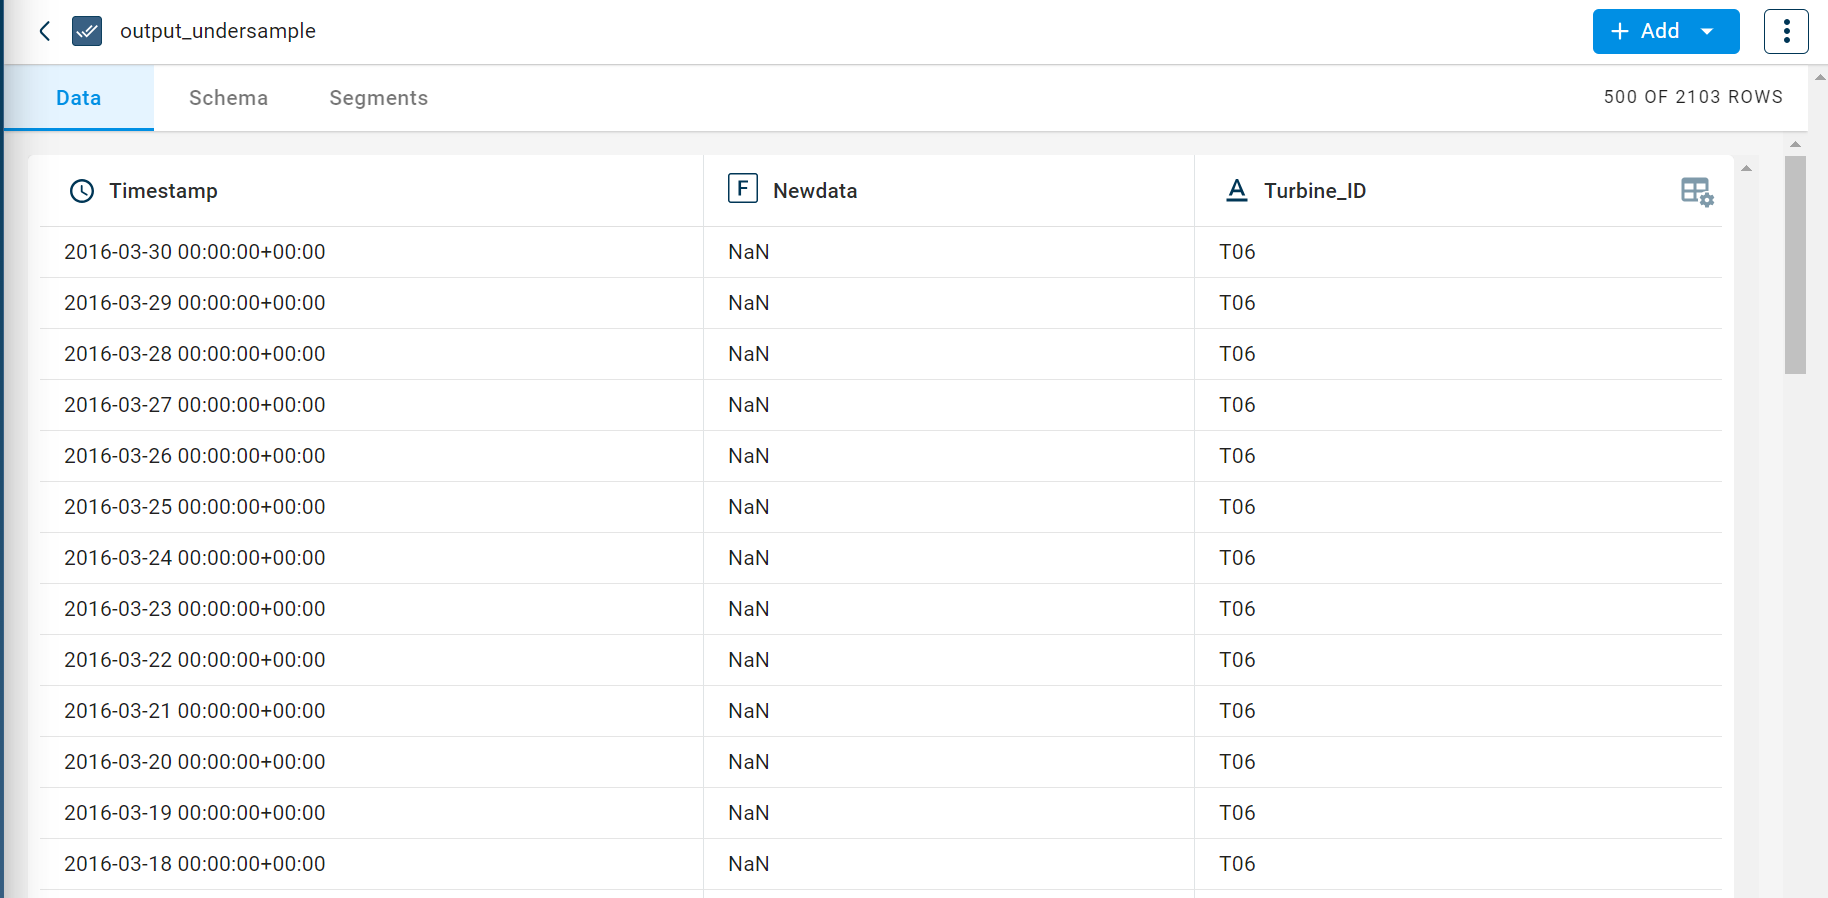
The sample input for this transform looks as shown in the screenshot:

The output after running the Undersample timeseries data transform on the dataset appears as below.

How to use it in Notebook
The following is the code snippet you must use in the Jupyter Notebook editor to run the Undersample timeseries data transform:
sensor_cleaned_recipe_predict = project.addRecipe([fill_null_predict_dataset], name='sensor_cleaned_recipe_predict')
undersample_timeseries = Transform()
undersample_timeseries.templateId = undersample_timeseries_template.id
undersample_timeseries.name='undersample_timeseries'
undersample_timeseries.variables = {
    'inputDataset': "fill_null_output_predict",
    'Col_to_undersample_by':'Turbine_ID',
    'Timestamp':"Timestamp",
    'Frequency': "D",
    'Resample_type': "MEAN",
    'outputDataset':'sensor_cleaned_predict'
}
sensor_cleaned_recipe_predict.add_transform(undersample_timeseries)
sensor_cleaned_recipe_predict.run()